Showing posts with label /ES. Show all posts

Monday, October 26, 2015

Market update

Previous market update here

We will not take any ST positions before FOMC meeting announcement on 10/28 - may be we will stay in cash 1 - 2 days later as well. 

The market exceeded the bullish expectations we had at this time . This was at a time when everyone and their mother including, were bearish and short the market. Everybody was clamoring for providing a good bearish number, most of them around SPX 1500 - 1600. So, where are these bearish pundits now after that breath taking rally in the last 2 - 3 weeks? Are they still short? ;) 

Many pundits are talking about this being the market top for the IT frame - we are trend followers, so we don't see any sell signal at this time. We will post when there is change in the update. 

Let's be honest, we were also not expecting this huge rally from /ES 1950. But, our stance is different = We do not have predictions usually, the above one is a rare instance. Hence, we are not shocked about this rally.  Usually we check our charts and take bullish/ bearish positions with an objective of scaling out in profit.  

Some of the positions taken previously (please updated "SilverVen's 100k portfolio for details):

Short $AAPL @ 110.22 - stopped out 2%
Short $SPY @ 200.3 - stopped out 2%
Long $TSLA @ 229.3 - Stopped out 2%

= Currently no positions

The 100k portfolio reflects all the above ST trades - does n't include the IT/ LT positions.

Current market update

ST - Buy
LT/ IT - Buy

We were stopped out of LT/ IT short $SPY positions in our fund @ /ES 2035 as mentioned in our blogspot several times, the last time being here . Even now our line of sand for IT/ LT positions is /ES 2035.

In IT/ LT positions for our fund, we flipped from sell to buy $SPY. 

Our indicator remained bullish throughout, from ~ SPX 1950 or so - please see chart below:

The blue arrow is where we took a ST short position previous week = false signal


Wednesday, September 2, 2015

Oil update

We will go on to discuss oil (/CL) but let's start with the general market (/ES / SPX) update briefly. In our previous post, we mentioned that we were surprised to see market tank down 2% yesterday morning. Because the market internals were poised for sideways/ bullish posture.  Well, we were positioned short; we still are positioned short (ST/ IT/ LT) with trimmed positions. 

Our outlook for 1-3 days (VST) was neutral/ bullish. The futures market (/ES) is up ~ 1% as of now. For the next 1 - 3 days, we remain neutral. We would not be surprised if we see /ES ~ 1980 one more time before driving south. 

But, we remain flexible as always. Opinions do change with the market changes.

VST - Neutral
ST/ IT/ LT - Bearish
_________________________________________________

Previous oil update here (please see chart in this post)

This is where we stand today (chart below): 


/CL rallied ~ 28% bottom to top. We do not have positions in /CL = none. But, based on our trading methodology, we would have taken 50% off the position on a good rally like that one. And ride the rest with the house's money.

The chart was obviously aimed at IT/ LT traders but if you score 25% profit in 3 days, would you say no? :) 

Anyways, the outlook for oil is

VST/ ST - neutral = get stopped out while you are still profitable

IT/ LT - Bearish ( we don't see any change in the outlook even after the rally) until next turn

GLTA!

Tuesday, September 1, 2015

Market update

Previous market update here
Oil update coming in the next post :)

There is no change in the current market update:

ST/ IT/ LT - All on sell signals

As mentioned in our previous market update, we have taken 50% off on 08/21 at ~ SPX 2000 on . 
On 08/26, at SPX 1925, another 25% off ST position has been taken off. 

Currently holding: 

25% of ST position (will close on signal turn)
50% of IT position (will close on signal turn)
100% of LT position (will close above /ES 2035 and turn into a "buy")

We have taken good profits into this slide since 08/20. There is no way we are going into red on these positions. 

ST commentary:

Currently market futures (Emini /ES) are down 41 points. We are positioned short and the signal turn has not come to buy yet. But, the current structure doesn't support this 2% down today = surprise. Hence, we anticipated that the market rally towards SPX 1987 - 2030.  

One of the reasons is chart below, our guage was in neutral mode as of close yesterday:


We anticipate the guage into bearish mode if the market closes in big red today, as futures indicate now. The chart is not a holy grail. But, based on the chart, we expected the VST rally to continue or at least sideways. Even though our positions are all short. The last time we posted this chart was here . 

Either way, let the market work its way downward. A change can be anticipated in the VST if /ES 1943 is broken to the upside. 

IT commentary:

There is a long time for this slide to go. May be we have seen the bottom on 08/24, we have no idea of telling. But, that slide has created a situation that the market should work its way up slowly rather than make a immediate V shaped rally. 

LT commentary:

Trend is down till proved otherwise. If /ES 2035 is broken up, then we will evaluate if the market may see new highs. 

GLTA!


Friday, August 21, 2015

VST market update


E-mini set up a positive divergence on the hourly. Go long with a stop at 2005 /ES. Only VST.

Tuesday, September 23, 2014

Market update

VST/ ST/ IT - Turned to sell as of close yesterday
LT/ VLT - Buy
 
 
We can use today morning's bullishness to sell short SPX. Previous market update here

Tuesday, September 9, 2014

Market update

VST/ST - Sell
IT - Turned to Sell at close yesterday
LT/ VLT - Buy

Previous update here


Saturday, September 6, 2014

Market update

ST/ VST - Turned to buy as of close on 09/05
IT/ LT - Buy
Previous update here
 
Our previous sell (VST/ ST) yielded some downside (to the 1988 SPX area) but wasn't good enough to capitalize on it, hence we got stopped out higher = loss. No problem, as it was only a 8 point loss.
 
 
Gold update
 
ST/ VST on a buy
IT/ LT - Sell


Wednesday, August 27, 2014

Market update

ST/ VST turned to sell
IT/ LT/ VLT - Buy
 
Previous update here 

Wednesday, August 6, 2014

Market update

Good morning Trader, How is you? 

I have taken a good break for a couple of months. I did miss a couple of market swings, but I was working on other important opportunities for myself. So, I didn't miss anything for not trading for the past 2 months. I got back couple of weeks back, I took time to settle into a rhythm, I traded on paper for 2 weeks. I am ready for new trades.

The market hasn't gone anywhere in the last 1 1/2 months. In the market, there are going to be phases like this. Hence, even if you are a market trader (trading /ES or SPY or QQQ...), you will benefit if you trade some other stocks with high volume, big market caps, no/ low news tickers. Every single ticker doesn't always rhyme with the market. 

Market update

VST/ ST/ IT/ LT - on Sell obviously (no positions)
VLT - ticked to Sell right now but too early as we are only in the 1st week of the month, things can change by the end of this month

For definitions of my time frame terms - click here 

We are on sell mode in all time frames, things look gloomy, huh? If you are already on the short side, hold on! I do not suggest new positions in the middle. I am looking for a turn, however. Few of my barometers have been suggesting a turn (one below in the chart) but price is king and indicators are queen. Barometers like the below only suggest me that a possibility of a turn is possible, but no guarantees till the price turns. 


I have posted this chart few times in the past to pick tops and bottoms. At this point of this barometer, it can be said we are forming a bottom. It doesn't mean you exit your current positions. It means that you should be on alert for the possibility of an exit/ scale out of your current (short market) positions.  

Gold update

VST - Buy
ST - Turned to buy at 9 am EST
IT - Sell
LT - Buy
VLT - Buy

Wednesday, May 14, 2014

Market update

VST/ ST - Turned Bearish (not taking this signal)
IT - Bullish (bought SPX at 1889 on 05/12)
LT - Turned bullish but waiting for the week to close for confirmation
VLT - Bullish
 
 
Previous update here
I was stopped out of VST/ ST/ IT bearish positions on 05/09 at SPX 1880.
This market grind is chopping both bulls and bears for the last 1 month in all indices and commodities. A breakout has not yet been established in any form of the market.
GLTA!


Thursday, May 8, 2014

Market update

Previous update here
 
ST - Bullish
IT - Bearish
LT - Bearish
VLT - Bullish
 
Sure is one hell of a market to trade, I agree. Take your profits, exit; Rinse repeat....unfortunately not so easy!

Wednesday, May 7, 2014

Update

Based on market update and methodology , taking half off ST positions at 1.5%. The other half will be closed at signal turn. GLTA!

Tuesday, May 6, 2014

Market update

Previous update here

VST, ST - Bearish
IT - Turned Bearish as of close today (Previous signal to signal yielded 23 SPX points)
LT - Bearish
VLT - Bullish

Timeframes and  trading methodology here


Friday, May 2, 2014

Market update

Previous market update here
 
VST/ ST - Turned Bearish
IT - Buy, hold
LT - Bearish
VLT - Bullish

Tuesday, April 29, 2014

Market update

Previous update here
 
VST/ ST - Bullish (turned now from bearish)
IT - Bullish
LT - Bearish
VLT - Bullish

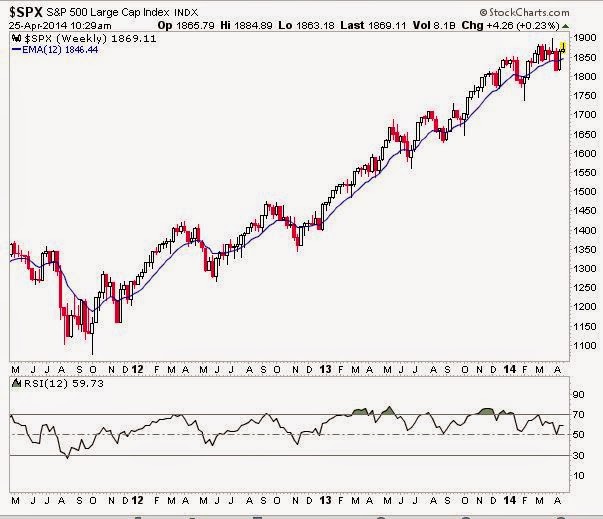
Friday, April 25, 2014

Market update

Previous market update here


VST, ST - turned Bearish
IT - Bullish, hold
LT - Bearish
VLT - Bullish
 
We have closed VST, ST positions earlier this week. We do not wait for the signal turns to close ST/ VST positions. Read our "Introduction" section above, for better understanding of our methodology. IT positions have a 3% stop from open. This ST bearish turn could easily become a IT bearish position, I will update when that happens. GLTA!


Tuesday, April 15, 2014

Market update

Previous update here .
VST - turned bearish this hour
ST - Still bullish, losing steam
IT - Bearish
LT - Bearish
VLT - Bullish
 
GDX, GLD, /GC
 
VST, ST - Bearish
IT - Bullish but on edge
LT - Bullish (next update will be at end of week, last LT buy was at 1285 - /GC with a 3% stop)
VLT - Bearish
 

Monday, April 14, 2014

Market update

ST & VST & Very Long term - Bullish
Rest of the time frames  - Bearish


Friday, April 11, 2014

Questions and answers

I have had 2 questions from my stakeholders, very important ones: One was about GDX and another about yesterday morning's market update.

1, On Wednesday, my analysis indicated a buy signal for the markets. Yes, it did - based on the 4 hrly charts and the daily charts. My update also indicated a hourly sell signal. Absolutely contradictory. I manage 3 portfolios. One for the long term, one for the swing trading, and another for frequent trading. I understand your question, as soon as you read this - not everybody has 3 types of portfolios in their account, especially the small trader.  Unfortunately, swing trading (on daily charts) has not been very good in this "bull market". I could not beat the SPX last year, only because my swing trading portfolio underperformed. I am not alone in this regard. If you look at any hedge fund, they all say it is a tough market environment to invest. One day the market is up 2%, the next day down 3%, it goes on and on. Is the market moving so much in the weekly horizon? Not so much!!! But, for those of us who are trading the daily charts, it has been tough. Really tough. On the other hand, trading (on hourly charts) has been excellent, especially with these wild swings. The Intermediate and long term trading (weekly and monthly charts) has been very good as well. Unfortunately, that has been the name of the game. Anyway, right now as of market close yesterday, all timeframes except the VLT are on a sell.

2. Someone asked me few weeks ago if GDX is better than GLD or viceversa. At the beginning of this year, I forecasted that both will outperform the market. And yes, they did (chart below). I have also noted that GDX will outperform GLD. Unfortunately, that has not been the case even while GDX has significantly been up for the year. The main reason being GDX is a basket of Gold mining stocks. Obviously, the stocks trade along with the general market trend. If market conditions are unfavorable to be bullish, and Gold charts are bullish, I would go with GLD or /GC (future traders). Not with GDX.

 With the market being brutal/ choppy, if you maintain some rules on a strict basis, you should still come out with gains from time to time.  Good luck again!

Thursday, April 10, 2014

Market update

Market update based on /ES & SPX
 
VST - Sell (based on current hourly chart)
ST - Buy (as of close yesterday)
IT - Buy (as of close yesterday)
LT - Sell
VLT - Buy
 
 
VST = hourly; ST = 4 hrly; IT = Daily; LT = Weekly; VLT = Monthly
These are my definitions, timeframes depends on volatility
 
Previous Gold update here . We are still nicely following the same trend, so I will post updates when trends change.
 
p.s: The earnings season is upon us. I would avoid earnings plays on individual stocks. I am not an earnings technician, I don't have the stomach for those gyrations. This is a nice time to trade the indices though, very manageable! Good luck!