Showing posts with label GE. Show all posts

Friday, November 13, 2015

Market update

Position update
 
We sold SPY short at $206.4 on a ST basis (added to the 100k trading portfolio challenge). Stop is at ~ $1.5 (break even) now that the position has returned $1.5 in our favour since started.
 
 
Market update
 
Previous market update here
 
Been a while since the previous market update but there hasn't been any updates as such.
 
Current update
 
ST - Sell/ Short
IT/ LT - Buy
 
Pundits are blaring now (as usual) that this is a continuation of a bear market started in Aug 2015. While we have many tools to look at that point of view, we are highlighting one of the gauges in the chart below:
 
 
Market hasn't entered a correction or was never in a bear market (in the last 15 years or so) when GE (General electric Inc.) hit new highs.
 
While we are short on our ST positions, we don't see this as a IT/ LT sell (/short) yet. Atleast the evidence doesn't point to that yet.
 
GLTA!


Monday, June 24, 2013

Market update

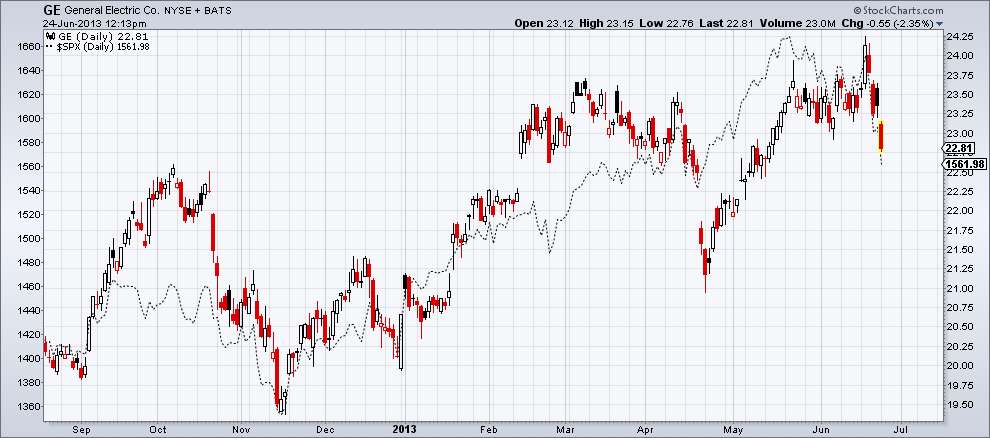
Please read my previous post before you read this. Read this May 4 post, because reading this will provide a better context for you to understand the current post. In those posts, I have outlined roughly that a break below SPX 1590 would put this market on an intermediate sell signal. A break below 22.75$ on GE would do the same as well.
MHCAX is one of the indicators I follow to see where the market structure is. I have an intermediate moving average scaled. Right now, this indicator is in an intermediate sell signal. After 2009, the only intermediate signal was in the summer of 2011. If you look beyond 2009 in the past, there are few times when this indicator whipsawed the hell out of followers. If you follow the markets ardently, you will realize that there is no holy grail. You have a set of indicators and watchlists to follow your game.
Visit StockCharts.com to see more great charts.

GE is one of my indicator. I outlined previously that 22.75$ is my line of difference between bull and bear. Right now, we are (almost) there. Not quite. I expect some bounce here and then go down, no guarantees. We could go down from here as well. Either way, we stay short of SPX below 1590.


Market update

ST - Bearish
IT - Bearish
LT - Bullish


Thursday, May 23, 2013

Market update

I posted "short term top" post 2 days back. I hope you read it before the bell yesterday. I was not surprised by the market action yesterday, not at all.
 
 
Visit StockCharts.com to see more great charts.


GE is one of the key stocks that market timers follow to time the tops and bottoms. I made a post on the market when SPX kicked 1600 level upside, that 22.75$ was the area to watch on GE. GE has done quite well to hold the level and pushed upwards. If you watch the overlay in the chart below, SPX made new highs in the last few days but GE is merely struggling against the March 1st week high. That to me is a divergence, atleast in the intermediate time frame.

 
The difference would be clearer on individual charts of GE and $SPX. Both GE and $SPX posted ugly candlesticks yesterday which indicate atleast a short term top. What would invalidate the short term top call? A close above yesterday's highs for both GE and $SPX.
 
 
What will confirm intermediate term top? GE closing below that yellow box.
 
 
What is our course of action right here? I have been fully long the market going into yesterday, although we had a caution before yesterday. I didn't close any longs yesterday. Today as I type this note, the market is still down but I am reducing my short term long holdings. On a further rally tomorrow, I will close more longs. If the tape pushes above yesterday's high and closes on a daily basis, I will add the closed longs. Long story short, I am still long. Anyone who has been long this year from day 1 would  still hold long. Why? Market is still up 16% at this time. I will close all longs on a close below 1620 SPX which means our portfolio will still be up for the year. I will go short below 1590 $SPX close.
 
I could go short on a very short term timeframe, but I would not advocate that to my readers - only because we cannot manage individual portfolios.
 
Market update
 
ST - Bearish
IT - Bullish
LT - Bullish


Saturday, May 4, 2013

Is this a start of a new bull market?


There is excitement in the air. The mood in the media is exuberant as the media cannot stop about this joyous moment. Few of my friends who have no interest in the capital markets called me to confirm my positions. The above pic says it all.  Was this rally due to real economic growth? Or was it due to FED's actions? I could care less about the reason. All it matters at the end of the day is banking coin in the portfolios. Hence, my earnest congratulations to the bulls who played this market rally! As soon as the market hits new highs, everytime a question crosses our minds. Is this the beginning or the end? Should we cash in our chips or should we push new money into the rally? 

At our trading pits, we follow some important indicators to mark the market turns. One of them is bluechip stock GE. GE is one of the stocks that almost always shows signs of exhaustion (ahead of time) in market rallies as well as bottoms.  

Visit StockCharts.com to see more great charts.

GE marked the top after almost every rally since 2003 in all time frames. My line in sand to be cautious was break of the Oct. top. That happened few weeks back was on not-so-good earnings number from GE. Since this market can simply run on fumes, I expected a vicious rally and that is exactly what happened. The market hit all time highs today on both the benchmark indices but one of our key leaders is struggling and has diverged from the market in the last few weeks. It indicates to me that leadership is diminishing, check AAPL, BAC, IBM etc. And, on a day like today when the market all time highs, I was surprised to see GE to print a big doji. There is high probability that GE is signalling to us the beginning of the end of the market rally, at least in the IT time frame and the rally from Nov. 2012 lows. 

I would not jump to a conclusion right here and say I am shorting this market on a massive fashion. I am merely cautious here. Irrespective of how many indicators you have, you must realize that the price ultimately talks. I will be looking for 2 numbers 1, If GE can continue above 22.75$ and 2, if the market can continue above 1590 SPX. 
Obviously if GE can push above 22.75$, there is no reason to doubt this rally. If GE cannot find its mojo to push above that line, I suggest you to be at the exit door. The previous high of SPX was 1597. That should be your typical market stop but given the ability of this market to run stops and shake us out, I will be wary to have a 10 point stop below that number. 

Right now, I am a cautious bull. Market topping is a process. It will take some time for the market to end rallies like this. I will enjoy the gains as long as the rally continues but I will be very flexible to change my position and short it. The exit doors will be crowded, so there will not be time to get out of the market, if this is the end of the rally. So, don't expect others to manage your positions on a minute by minute time frame. Good luck!

p.s: I made a market top post days before the previous (Sept 2012) top. Based on my assumptions, we thought it was the end of the bull market from 2009. There were indications of exhaustion but I also gave hints on what would make this long term rally continue. As I expected, this market topped but only on the IT time frame and not on the LT. We shorted the market around Sept 2012 high but we also reversed our position in Nov. 2012.