Showing posts with label GOOG. Show all posts

Wednesday, November 21, 2012

GOOG


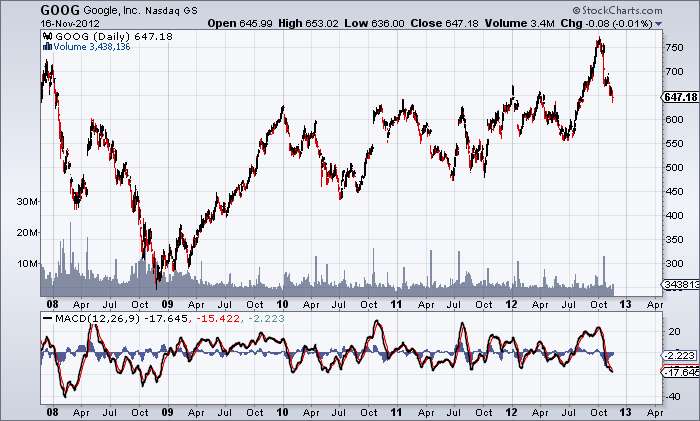
I believe GOOG counter trend rally is over. In the next few days, GOOG will either post a low at the 11/16 or lower than that. No positions, just interested in watching.


Visit StockCharts.com to see more great charts.

Sunday, November 18, 2012

Ringing the register - capital gain taxes

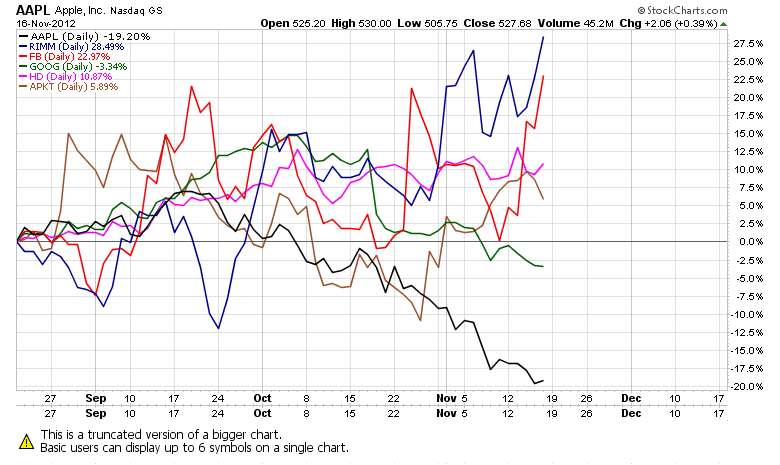
Investors have been puzzled why the (supposedly) best tech stock in the world AAPL has entered the bear market territory recently. One of the thesis that has been floating around is, long term investors are locking their profits after a tremendous 3 year run. On the other hand, stocks like RIMM, FB which have been on the losing end have gained in the last 2 months. How come? Investors who have been long the winning stocks are closing their positions by selling, while investors who have been short the losing stocks are closing their positions by covering. A strong reason to believe this is probably an increase in capital gains taxes next year. The 1st chart shows YTD run in all the highlighted names.
Visit StockCharts.com to see more great charts.

The 2nd chart shows the performance in the last 3 months.

So, should you be loading on the winners, after this 'sale' is over? If you believe the strong fundamentals are intact, you may do so with caution. But, I insist that you exhibit a fair bit of caution in buying stocks whose technicals have been severely damaged like this one. Damage to the technicals in a stock will skew the view of investors, no doubt. Till the time the technicals are corrected, you may stay away from those stocks.

I included Homedepot HD which has been up a good % in both the charts, despite selling seen in other names. HD is sound both technically as well as fundamentally. In ideal case, given the ongoing market correction, I am not suggesting you to go long any stock right away. But, should the market rally after the market internals rise, names like this would be the 1st on the radar.

Friday, November 16, 2012

Fortunes will be made and lost - AAPL

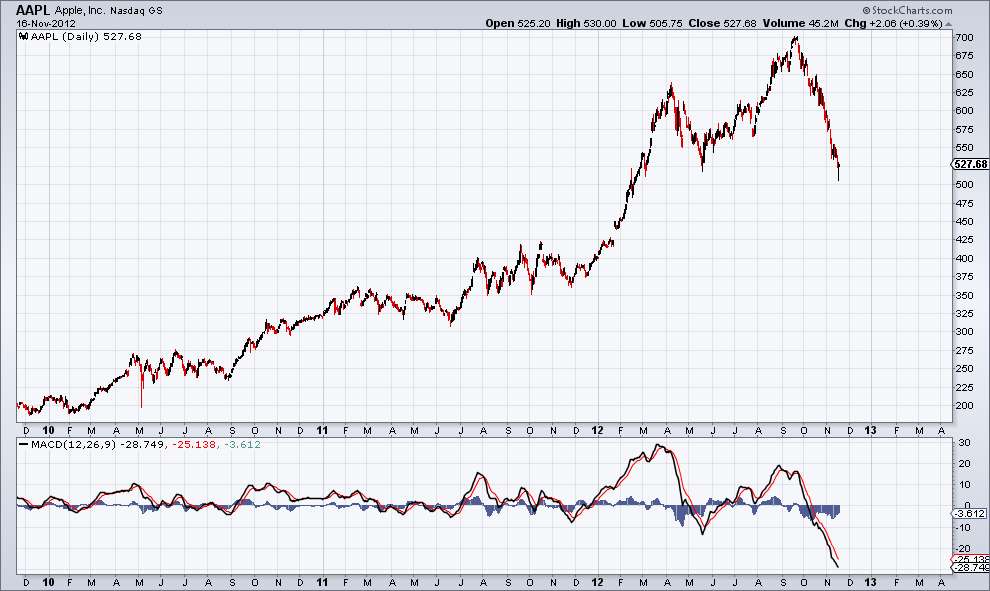
This is wallstreet. Fortunes are made and lost here in regular and tandem fashion. That is no surprise. We see a dot-boom go bust with high degree of periodicity. AAPL as a stock is up 30% YTD. That is not the full story though.  It was up about 74% about 2 months back. It retraced 25% since it's Sept high of $704. That is still not what bothers me. The velocity with which it is sold incessantly, despite being the global innovative leader in a bunch of leading electronic devices, holding 100s of billion $s of cash in hand, solid reputation at stake is what makes me think deep. Something is wrong behind the curtains. Also, it is easy to justify the high market cap when the company is at its prime, people realize the problems only when the stock goes bust.  While we don't yet know what that 'something' is, our charts show that the ticker is very very disturbed. It is often said that the stock market is often a reflection of behind-the-scenes action, I can't comprehend what I am seeing. Wall street is brutal and doesn't care for reputation, innovation or leadership. 

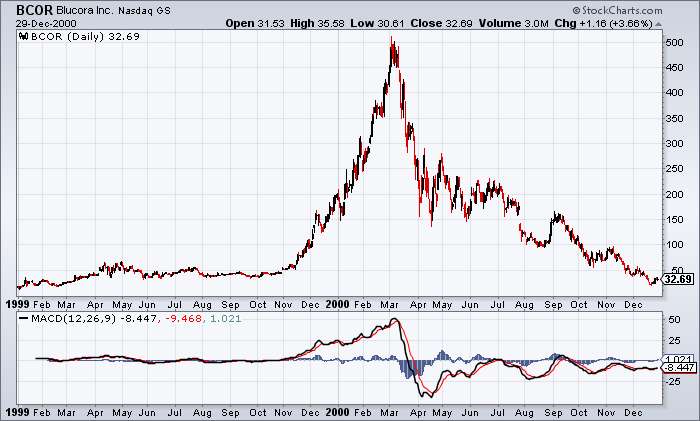
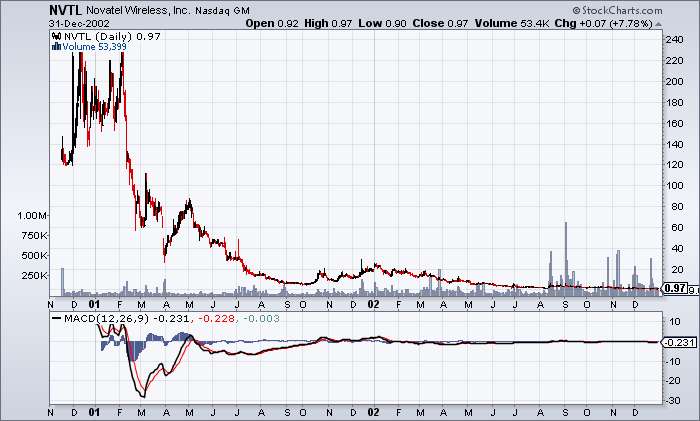
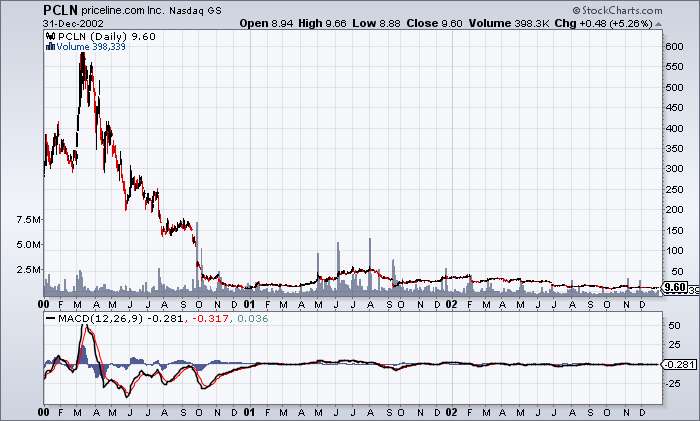
For comparison, I have summoned the great dot-busts from the 2000 stock bombs. I looked at almost 100 charts of tickers including YHOO, MSFT, AMZN, PCLN (all of which still exist, only with a minuscule of their stock's prime valuation) and then some tickers which don't exist like BCOR, NVTL. I noticed that in today's AAPL chart, the MACD indicator is extremely oversold. A bottom or top in the MACD indicator never ever occurs simultaneously at the same time with the price of a ticker. Usually the MACD indicator tops or bottoms and then days-months later the price bottoms. Sometimes years later, in extreme cases like this. The MACD indicator has gone below - 25 which we rarely see. It often indicates violent plunges are ahead. There may be short killer rallies in between but these kind of stocks with extreme monstrosity are hard to predict and more often than not end up losing most of the market cap. I know, it is hard to imagine AAPL going bust with virtues as underlined above but this is wall street folks. You could create history or you can be history riding AAPL from here. 

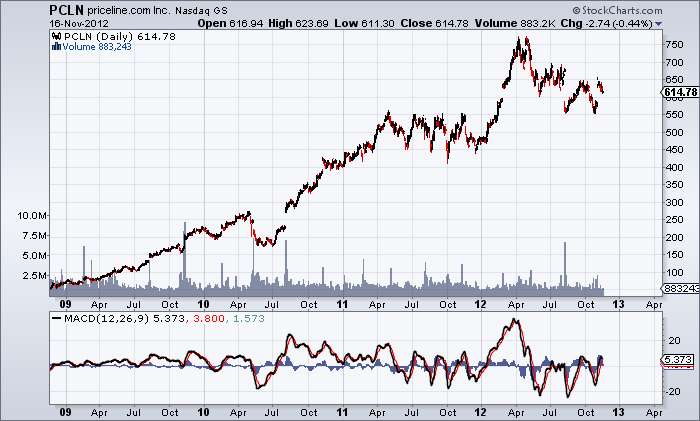
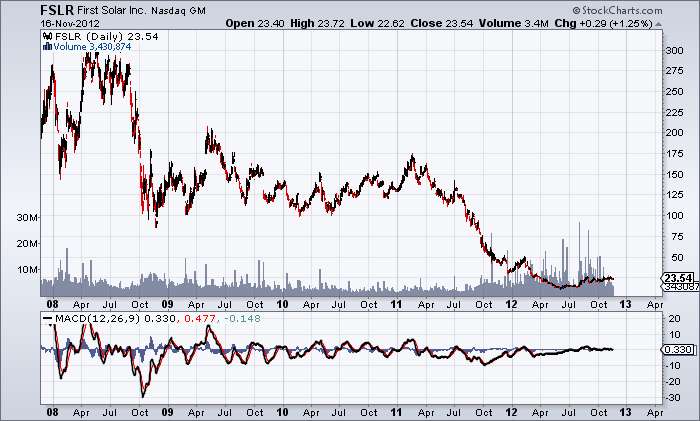
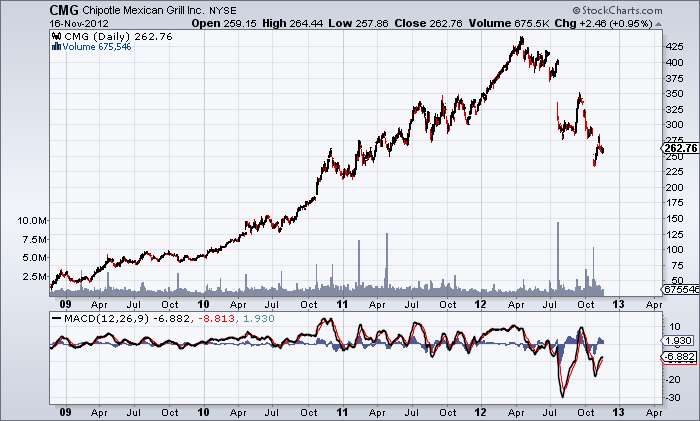
I am including charts of BCOR, NVTL, PCLN from the dot bomb era, GOOG and FSLR from 2008 market crash, PCLN and CMG from the current era from the comparison with current AAPL's chart below. BCOR, NVTL went chapter 11 while PCLN recovered. PCLN continues to show the same violence with precision every year in its charts. CMG is the latest example of one high flying stock which has gone bust in recent times.

Bottomline is -  All time top in AAPL is in. The bottom of short term, Intermediate term or long term is not yet seen. Extreme and violent moves on both directions will continue in the months ahead. I am reading several posts of 'V' bottom. Yeah, right! It is not that easy, folks! Bookmark this post and we will meet in 6 months. 

In the charts below, concentrate on MACD extreme reading and what fate followed  for each ticker ahead. 

Current AAPL


BCOR from dot-bomb era


NVTL from dot-bomb era


PCLN from dot-bomb era


PCLN current chart


GOOG from 2008 crash


FSLR current


CMG current


AAPL current


Saturday, June 9, 2012

Priceline weekly options

You must be aware that the market rallied 20 points ($DJI) into the close yesterday. I was watching Priceline Inc. (PCLN) and the weekly options. I had no positions though. Priceline rallied from ~ 639$ to 644$ in 20 mins before close. I was watching the 640$ calls that expired yesterday. In 20 mins, the call options gained >700% from ~ 0.45 to close at 4.30$. Was the last minute surge on this big kahuna done to push the weekly options? I don't have material evidence to prove it. But, the volatility in the big names (GOOG, AAPL, CMG, PCLN etc) has increased a lot since the weekly options have been introduced. The OTM weekly options, expiring on friday, move 300 - 700 % in the space of 4 days beginning Tuesday afternoon or so. This is only for educational purposes only, I usually do not endorse options officially. This gives you an idea of another instrument in the stock market.


Below is the 1 minute chart covering the last 2 hours of the 640$ call options that expired yesterday at 4 PM ET.

Tuesday, January 10, 2012

GOOG intraday

GOOG showing a positive divergence on the hourly with the RSI14. Let RSI cross the 55 level, buy GOOG with a stop at today's low. Bullish play is VST only, ST remains bearish.


Saturday, September 10, 2011

Choosing an index to trade?

In this blogpost, you will find
1, When do I prefer to trade individual stocks/ securities?
2, What ETFs do I use to trade? Which index do I prefer and why?
3, Can we use leveraged ETFs?

When VIX is below 20, I would like to trade individual stocks on an Intermediate term. When VIX is above 50, I would like to start nibbling at individual stocks increasing position size as VIX increases for the long term. When VIX is between 20 and 50, I am comfortable trading for the short term, more into ETFs. I defined my short term, Intermediate term, and Long term trades here.

If your total portfolio capital is small (say 5000$), trading ETFs will help as you need not be scared about volatile swings in the individual item and face loss. For example, if you have a stock XYZ in your portfolio, and that company posted bad news, earnings result, or downgrade by analyst, and it went down by 10%, you will face a haircut of 500$ which is significant for a 5,000$ capital. To make it back is not easy. I personally would be uncomfortable trading individual stocks if my capital is small. If you trade ETFs, you don't have to worry about news, patents, product releases, earnings reports, downgrades. If you trade ETFs, you can save time by analyzing the general market trend instead of going through all the above. Whether your capital is small or big, I prefer ETFs unless you have a compelling arguement where you stand by your own risk.

If I choose to trade the major indices, I prefer the SPX via SPY or the Russell 2000 index via IWM.

SPY and IWM match my preferences for
1, Being highly liquid: You always need to buy a stock or ETF which is highly liquid and highly traded. Highly traded means you have narrow bid x ask spread and which will give you a chance to get out at any point of time, even during extended hours - should there be a high gap up or down (for or against your position). Unless compelling and long term investment, you never want to be in a stock which doesn't trade much in extended hours. Our goal is to have control on every penny of our money, as much as we can.

2, Basket of stocks: SPY represents SPX which is an index of 500 stocks. SPX's price is not influenced by one of the stocks ever. Same with IWM. On the other hand, NASDAQ100 via QQQ has giant market cap names like AAPL, GOOG, QCOM, AMZN which form 50-60% of the index. One of those names can easily influence the sway to one side on major news on these companies which will mean that the technicals basing on which we buy or sell the index is thrown to the dustbin. In the same way, $DJI also consists of only 30 names which means one of them could easily influence the index.

I prefer SPY and IWM for that reason. If you are comfortable with a high beta, go with IWM. Otherwise SPY should just do fine. Great people master simple things perfectly, they don't master perfect things.

I don't recommend trading leveraged ETFs, I may trade on my own but that is at my own risk. If you see me buying TNA (which is 3x daily bullish IWM), then my recomendation would be for you to buy IWM.