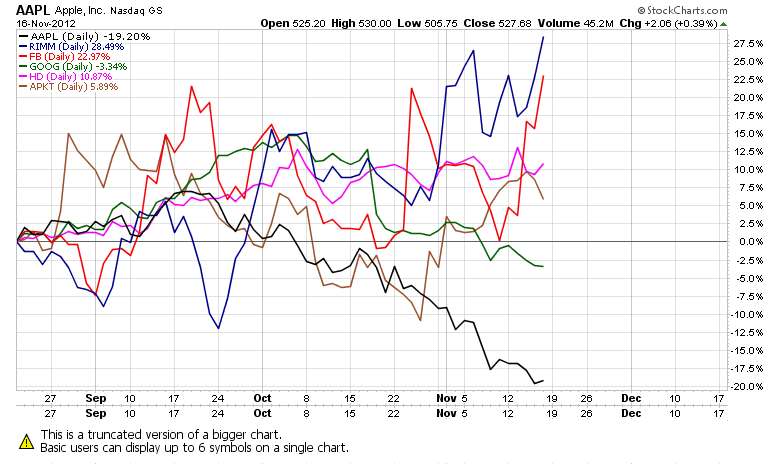
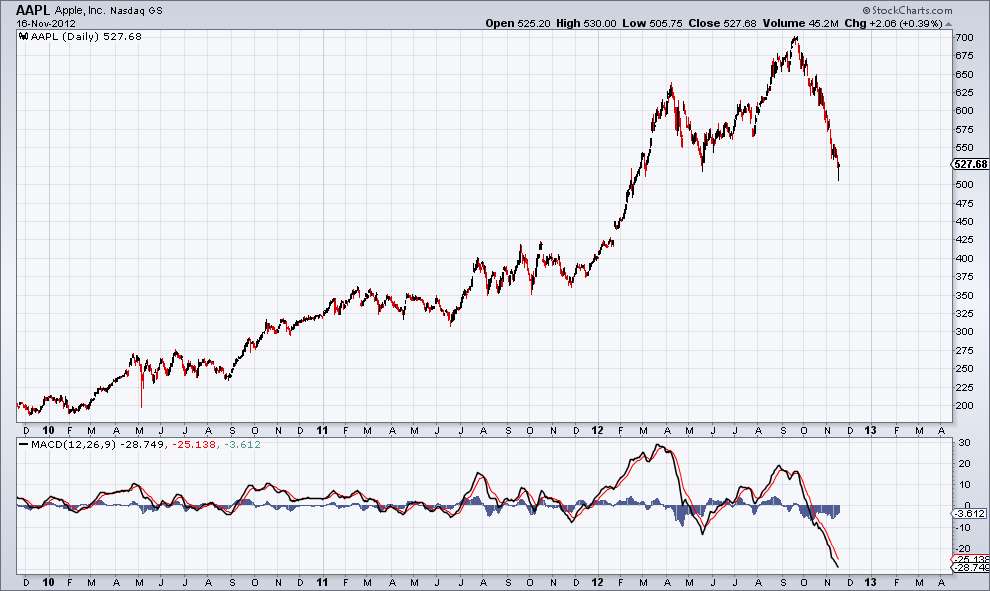
This is wallstreet. Fortunes are made and lost here in regular and tandem fashion. That is no surprise. We see a dot-boom go bust with high degree of periodicity. AAPL as a stock is up 30% YTD. That is not the full story though. It was up about 74% about 2 months back. It retraced 25% since it's Sept high of $704. That is still not what bothers me. The velocity with which it is sold incessantly, despite being the global innovative leader in a bunch of leading electronic devices, holding 100s of billion $s of cash in hand, solid reputation at stake is what makes me think deep. Something is wrong behind the curtains. Also, it is easy to justify the high market cap when the company is at its prime, people realize the problems only when the stock goes bust. While we don't yet know what that 'something' is, our charts show that the ticker is very very disturbed. It is often said that the stock market is often a reflection of behind-the-scenes action, I can't comprehend what I am seeing. Wall street is brutal and doesn't care for reputation, innovation or leadership.
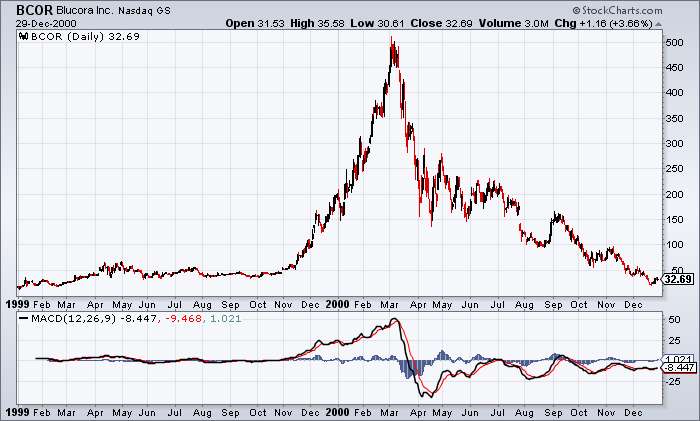
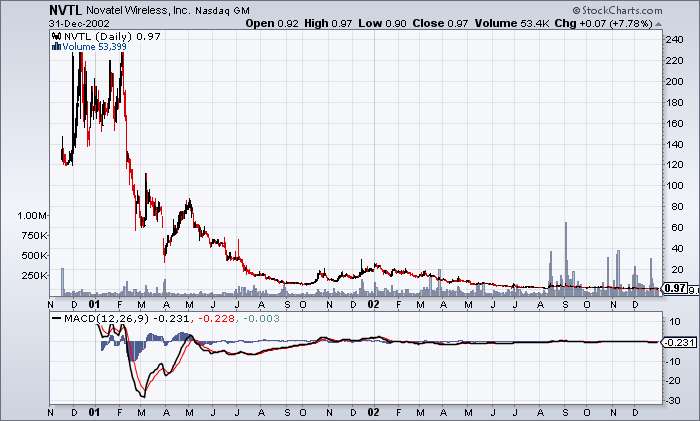
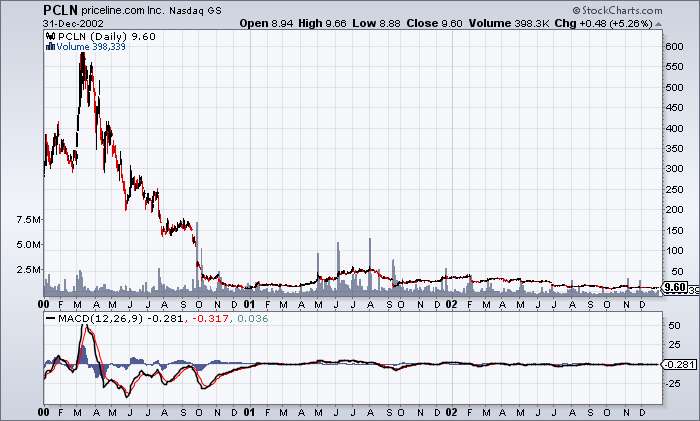
For comparison, I have summoned the great dot-busts from the 2000 stock bombs. I looked at almost 100 charts of tickers including YHOO, MSFT, AMZN, PCLN (all of which still exist, only with a minuscule of their stock's prime valuation) and then some tickers which don't exist like BCOR, NVTL. I noticed that in today's AAPL chart, the MACD indicator is extremely oversold. A bottom or top in the MACD indicator never ever occurs simultaneously at the same time with the price of a ticker. Usually the MACD indicator tops or bottoms and then days-months later the price bottoms. Sometimes years later, in extreme cases like this. The MACD indicator has gone below - 25 which we rarely see. It often indicates violent plunges are ahead. There may be short killer rallies in between but these kind of stocks with extreme monstrosity are hard to predict and more often than not end up losing most of the market cap. I know, it is hard to imagine AAPL going bust with virtues as underlined above but this is wall street folks. You could create history or you can be history riding AAPL from here.
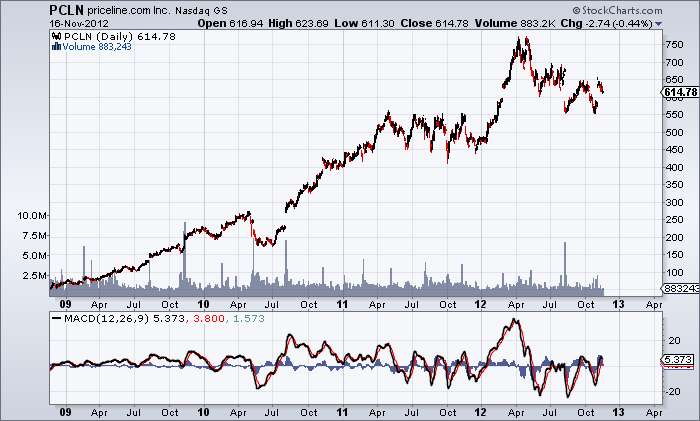
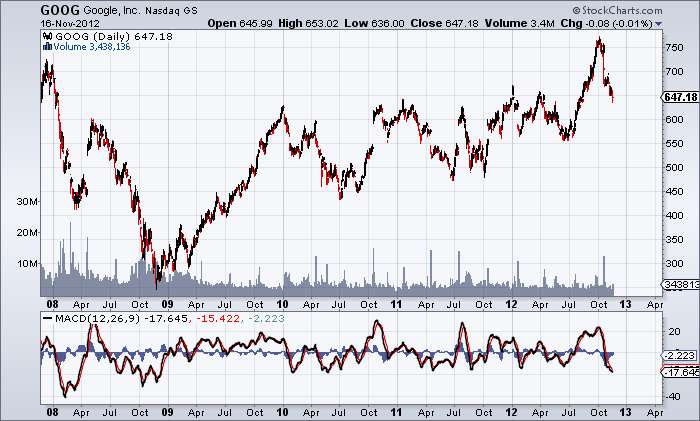
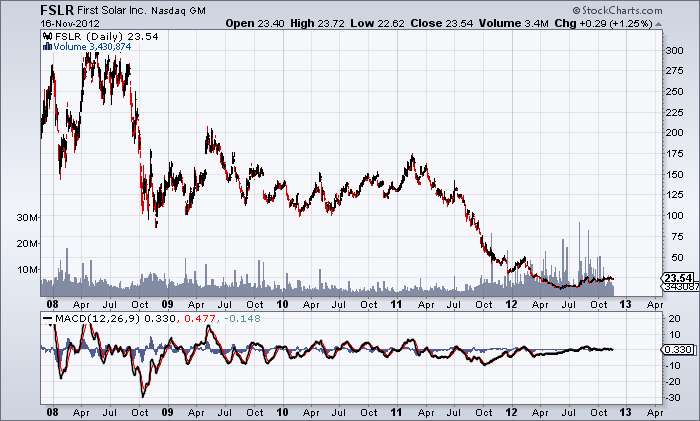
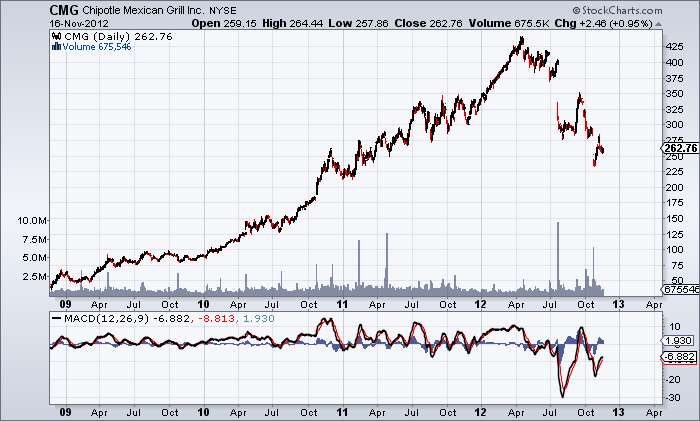
I am including charts of BCOR, NVTL, PCLN from the dot bomb era, GOOG and FSLR from 2008 market crash, PCLN and CMG from the current era from the comparison with current AAPL's chart below. BCOR, NVTL went chapter 11 while PCLN recovered. PCLN continues to show the same violence with precision every year in its charts. CMG is the latest example of one high flying stock which has gone bust in recent times.
Bottomline is - All time top in AAPL is in. The bottom of short term, Intermediate term or long term is not yet seen. Extreme and violent moves on both directions will continue in the months ahead. I am reading several posts of 'V' bottom. Yeah, right! It is not that easy, folks! Bookmark this post and we will meet in 6 months.
In the charts below, concentrate on MACD extreme reading and what fate followed for each ticker ahead.
Current AAPL
BCOR from dot-bomb era
NVTL from dot-bomb era
PCLN from dot-bomb era
PCLN current chart
GOOG from 2008 crash
FSLR current
CMG current
AAPL current