Thursday, October 27, 2011

Shorts can stay solvent longer than you think

Chanos made good money shorting Chinese stocks since 2010.

Chanos in Bloomberg

The Chinese stock market's performance over the last few days is insipid and uninspiring to say the least. While global markets rose anywhere from 15 to 20% in 2 weeks, SSEC's gain was limited to 3%.


Short sell FXI on a SSEC break of the October lows.

Technology not confirming the rally


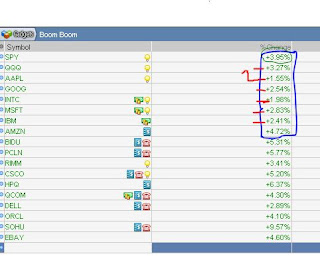
Boom Boom Tech not confirming this rally. When was the last time that all of QQQ, AAPL, GOOG, INTC, MSFT, IBM underperformed the market. They don't have to outperform the market every single day but on a day when market is rallying hard, they should be outperform the market. 

Having said that, I don't believe this is the time to sell short. I believe I see the market higher than today in 2 weeks, 1 month time. Before that, there could be corrections. That means this is not the time to buy either. You don't want to buy at the top, just in case this is the top.

Monday, October 24, 2011

Hanging Man

I posted this on 10/16/2011.

1, Market followed in a textbook fashion till now. We had a lower low towards 1187 and then we hit 1257. Where from now? The market is still in a uptrend, till the next sell signals arrive. Don't be early to sell short.

2, VFC: It looks like the channel held VFC back today. There have been several attempts to break above, albeit unsuccessfully. What do you call the candlestick today? Hanging Man! I feel comfortable selling short here with a proper stop. Tomorrow should bring us confirmation of the hanging man patten. Tomorrow should also bring us AMZN's earnings results.

VFC daily chart here

Saturday, October 22, 2011

US Dollar Index


The US Dollar index is definitely in a bearish trend. For now, the 50 DMA provides support. US Dollar index is a risk off trade, and is inversely correlated to the US stock market. I expect the 50 DMA to break next week and the 200 DMA should give good support. Will 200 DMA hold? The MACD is turning down which indicates the continuation of the trend down. The histogram also ticked one down than the day before. For the MACD to turn up again (to turn this chart to bullish), it will take atleast few days time. Meanwhile, the candles should bounce on the 200 DMA. There is also the previous breakout support at ~ 75. If the 200 DMA doesn't hold and the MACD continues downward, then it is ultrabearish for the Dollar index and uberbullish for the market. You can also note that Eur/USD is just pips away from the upside resistance. Both these currencies can play pingpong in a small range for the next few days, and markets will definitely take it as positive. 

Thursday, October 20, 2011

Wednesday, October 19, 2011

Market signal

/ES gave me swing sell signal afterhours. Trade here . I will write some rules (over the weekend) while I am trading these signals. Be patient.

SPY P/C ratio is a bit high at 1.88, so there may be some hesitancy in the sell zone. Regardless, I have to take this trade on my signal to follow some discipline here.

Earnings results: The never ending Oxymoron

Just like the NY Athletic Club, earnings results and the stock run that follows almost always never matches. Isn't that why I always suggest you to stay away from Las Vegas unless your pocket is itchy? If you had an extended run on the same ticker for sometime, that's a different thing and rightly so, you could just hang there with buying some put protection.

I present 2 results on a single day and the way their stocks reacted. IBM delivered a very good quarter yet again but for stocks that have run for a long time before the results, very good simply doesn't translate into after run.

Goldman Sachs on the other hand delivered 2nd loss only in 12 years being on the public stock exchanges. GS was up 5%. 


Tuesday, October 18, 2011

AAPL earnings preview

AAPL reports earnings after the bell today. The bull bus on this ticker is heavily loaded so much so that if you say AAPL will go lower on earnings to someone, you will be looked like a fool. It is forgotten that AAPL is also a stock which has every chance to fall just like it rises.

In the recent days, AAPL formed a negative momentum divergence. I expect a pull back after earnings. You can also see sort of channel formed, right now AAPL is at the upper range of the channel.

We rarely short at the top. So, this is an advice to buy protection if you are long. If you have no position, please don't enter before earnings.

The day begins with sweet music from BAC and GS though.

Monday, October 17, 2011

Market signal

I have a sell signal on /ES. I am taking that signal via SPY

Sunday, October 16, 2011

Market update

Please read my previous post . That post came at a crucial time, atleast for the swing period. I used the word miracle for the market to go up, and yes it indeed happen. My line in the sand to open a long position was 1198 (and close any short positions) and effectively that was taken out in a big whoosh in the last hour of that day. We are on Wall Street business which means you should expect miracles to happen. Fortunes are made and lost here; to make a fortune, risk is often needed with proper asset management. If you had gone long at that time and taken profits all along the way, you should have gone up by 5 - 10% atleast depending on your asset allocation and profit taking. There were small pullbacks in between but no pullback was greater than 2%. That 2% number should ring a bell because usually, if and when I am trading market ETFs I use a 2- 2.5% stop. So, if you have gone long and placed a 2% stop there, you should have been up all the way without getting stopped out, if you didn't take profits manually. Have I done that? Unfortunately, I missed it. 2 reasons: I had a busy weekend at that time with travel being part of it. But, the bigger reason was my bias towards being bearish. I was in cash at that time but later I have gone short on a small SPY position (at 116.49$) which is in loss and has not been stopped out (at 2% because that is small position)  which is another mistake. So, basically if you take a wrong position, you just pile up on your mistakes. Lesson learnt! Enough on that as it is time to move on..

30% of the SPX constituents report earnings next week. While momentum is in the market's favor, too long too fast in too short time is not in the market's favor. In 9 trading days, market has gone up 10%. Usually it takes months to go 10% up. That 10% number hurts me when I think of it. At this point, I am looking at the chart below. My bias is to the upside but with a pullback. We are sitting at the 50% retracement between May top and recent low. I believe we will test 1187 and go up. If we do not get a pullback here (which is unlikely as the market cannot go up every single day), then we should test 1257 soon. What should you do? If you don't have a position, do nothing. If you are long, take 75% of your money off the table. If you are short, wait for a pulback but have a 2% stop up. I will be trading different positions and posting on the trading blog , so I will answer any of your questions there if needed.

                                                                 SPX daily chart


A different look at the market from the currency standpoint. We are at a crucial stance on the Eur/ USD. We are effectively a day or two from the resistance that was previously a rock solid support. Eur/ USD may test that, or it could fall from here (without testing resistance) as often prices may not go to the test point.

Eur/ USD daily chart


Please remember that the seasonality from Nov - December into the holidays is with a upwards bias. Seasonality may repeat or not, but please have that in your mind. My target of 1257 into November comes with that bias as well. I present 2 good looking charts for you:

AMZN daily chart 


AMZN above is in a wedge that should break on either side on the coming earnings date of 10/25. My guesstimation is that AMZN will continue to be in the wedge before earnings. Since the push up has been relentless recently, you could short sell at the resistance by selling AMZN or sell the weekly 250$ calls. You should have a stop at 252$, regardless of what trade you take of the above 2. Please get out of your positions before the earnings date as I don't suggest playing earnings ever. 

VFC daily chart


VFC has been in a channel with a small wedge taking part recently. You could go long on the lower trendline (of the wedge) test, open a small position. You could double down on the channel's lower trendline test. I see VFC higher in December than today, that is my bias. But, since we have a channel, you can take long or short positions based on the breaks in either directions. Earnings report is on 10/24.

In addition to the above charts, I have a proprietary buy/ sell signal which I will update when I get it. The signal is a recipe for taking the money on the table and is usually worth 30-40 SPX points atleast on the average. I will post my signals when and if I will get it. The signal is on a buy since SPX 1130.


Tuesday, October 4, 2011

Sleeping sickness

Hang on! The bottom did not drop out yet, not yet. Tell me if this drop will hold, I will pray to Thee my Lord for the miracle. If you are looking to go long for a swing, I  would suggest you to do that when we clear that small horizontal trendline in the middle of the chart. You can play the small bounces in between, so that you can buy icecreams for your kids, or pop sodas, chewing gums for yourself. Otherwise it is not worthwhile. You can go full stop short sell below the big bottom line with a 2% stop. I usually do not suggest shortselling (though I do it myself at my own risk many times) but this chart looks too enticing.

The real moves will happen during night because the above chart is Emini futures, hence I used the term "Sleeping Sickness". Well, this is not African Sleeping sickness but the American version of it.

Always keep in the mind the Dracula version of the markets, I posted what they may do.

Review of the European market indices

FTSE and DAX have been trading in a box for the last 2 months with the momentum moving up. All 3 major indices escaped the bearish cross down. It looks like that the down cross is inevitable this time around. I don't see anything bullish at this time. They are poised to go down. We will review after one week.


Sunday, October 2, 2011

Weekly sector review

For the past week, financials were the leading sector while the Material sector is lagging all others.

In September, the basket stocks of Utilities was leading while the materials remains the loser.

For the Q3 2011, Utilities and the materials were the leading and lagging sectors respectively.

YTD and in the past 1 year , Financials were leading the stock market down while Utilities lead the sectors.

I suggest you look at the figure below to analyze which sectors lead the economic cycles and understand the current situation.

If it is not obvious to you, let me explain. The Utilities lead the sectors in the downtrending economic cycles - beginning or in the middle of recessions. You might be wondering what I am talking about while the GDP still shows growth. NBER lags by atleast 2 or 3 quarters, they come back and revise the calls as far as quarters upto 1 year. It is very well possible that, in future revisions, NBER may come and say we have been in recession since Quarter 2 of 2011. Or this quarter may be the beginning of the recession. 


Saturday, October 1, 2011

Quarterly performance

Our fund review for the Q3 '11 ended shows a net gain of 16%. We hold no positions at this time. We swing trade or invest in buy and hold when conditions are favorable. When the market is volatile, we actively trade our positions. While market volatility is definitely a cause of concern for investing, our funds adopts a 2 pronged approach to different markets. Our total fund gains YTD have been 39%. We allocate our capital to 2 portfolios in order to maintain a balance between the 2 approaches. One portfolio (I) invests only when conditions are most favorable and another portfolio (II) trades aggressively. Asset allocation ratios in these portfolios change depending on the market trend. Portfolio I has a YTD gain of 13% while Portfolio II has a YTD gain of 46%. Most of my positions trade in ETFs. This helps us to maintain safe positions while still being in profits.

At this time, we hold no positions and remain in 100% cash. For an insight to our trading activity, you can subscribe at Stock fund blog.