Tuesday, December 31, 2013

Portfolio performance 2013

Please read Introduction 1st.

For the year 2013, net profit at Silver Ven is 23.5%. I am not impressed at all, considering the shame of getting beaten big by the general market ( SPY up by 31.89%), other peers in 2013 and our own performance from previous years. That goes on to reiterate the fact that past performance is no predictor of the future. Our winners for the year were AAPL, FB, NFLX, TSLA, LNKD, ISRG, RAX, TWTR, Index via SPX while we had small net losses in PCLN, GDX, AMZN, CREE, FSLR. I am only mentioning the top winners and losers, we have a big list out here. Our trading involved much more than the above mentioned tickers. One of the problems why we were not up big like the previous years was that the market swings  have become small and quicker. We had a great beginning with the buy-and-hold mentality till April/ May. Considering that we are positioned as a swing trader to maximize gains both up and down, many of these later swings turned into whipsaws cutting into the gains earned prior.

Few good and clean things that we wish to maintain into 2014:


  • Position sizing and risk - We are good at proper risk maintenance and proper position sizing.
  • Bias - When the market remains irrational for longer than we think it will be, the good thing about us is to sit out when we are in disbelief. Means we do not take opposite trades based on our beliefs. If we do not have good belief in the market conditions, we sit out but not take the opposite trade.
  • Stops - While I agree too many swings can cut into profits when we have stops, we do not mind getting stopped out. Belief is eventually one of those swings will turn into a big one far exceeding the small stop losses.
  • DCA - When there is a bad trade, cutting the trade is the best thing. We do not average on the trade digging a bigger ditch.
  • Widow makers - Traders have a big list of widow makers like UNG, VXX. We do trade tickers like this but are aimed at very short term trading. Never buy/sell-and hold into these tickers.

I wish all our readers and fellow traders a Happy, Prosperous and a Wealthy New Year 2014. Keep up your good spirit, you will never lose!

Thursday, October 24, 2013

Tuesday, October 15, 2013

GDX

Bought GDX, SINA - Both intermediate term positions.

SINA - Stop below 80$,
GDX - 1/2 position, will add if stock sees 20.0 - 20.5

Monday, October 7, 2013

Market update

VST - Bearish
ST - Bearish
IT - Neutral (cash)
LT - Bullish

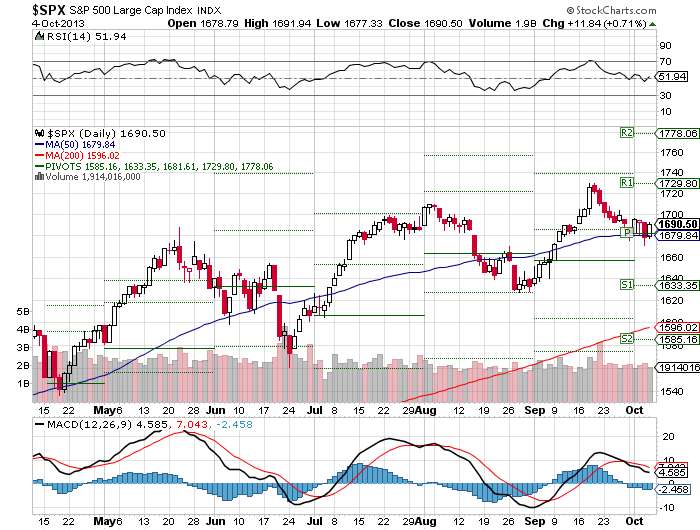
The pivot points presented below should be good.

Visit StockCharts.com to see more great charts.

Thursday, August 8, 2013

The most hated trade in the last one year...

What is the most hated trade in the last one year? I am buying it if the ticker crosses 50 day moving average, for at least a 30% upside in the next few months.  DUST should be below $50 very soon. This is an "Intermediate term" trade. Not long term, long term is still down. Chart below: 


Thursday, June 27, 2013

Real estate iShares


Visit StockCharts.com to see more great charts.

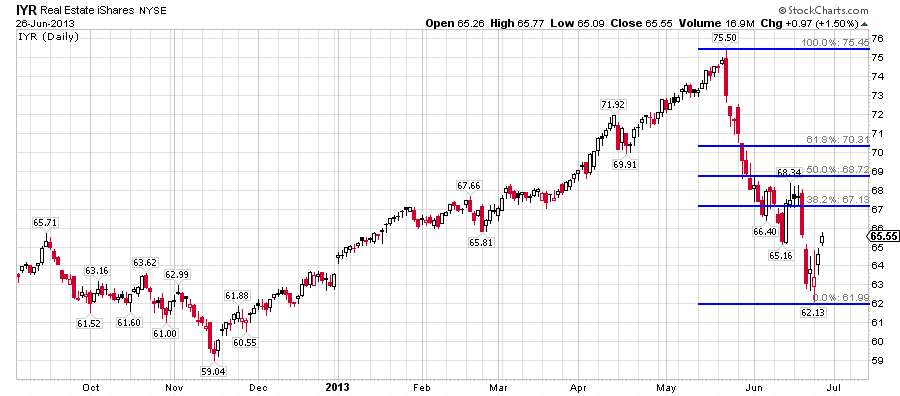
IYR is in intermediate downtrend. Sell short between 67 - 68$, if the opportunity arises. Stop 71.5$.

Monday, June 24, 2013

Market update

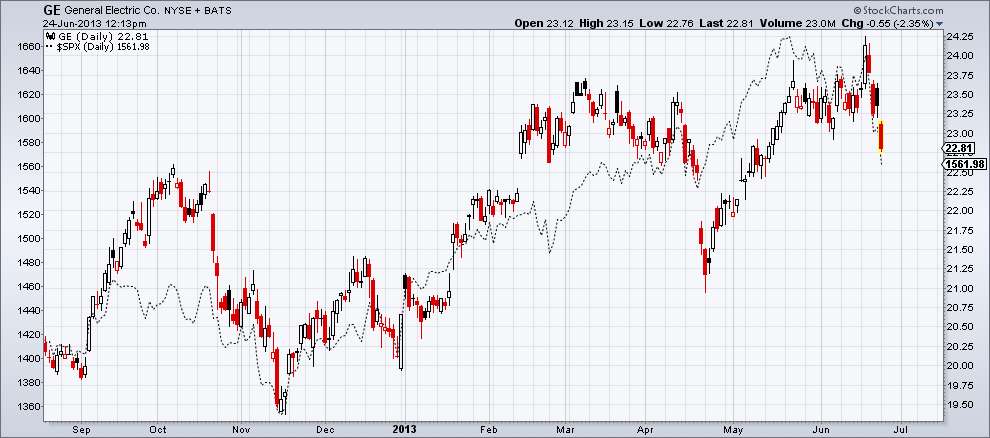
Please read my previous post before you read this. Read this May 4 post, because reading this will provide a better context for you to understand the current post. In those posts, I have outlined roughly that a break below SPX 1590 would put this market on an intermediate sell signal. A break below 22.75$ on GE would do the same as well.
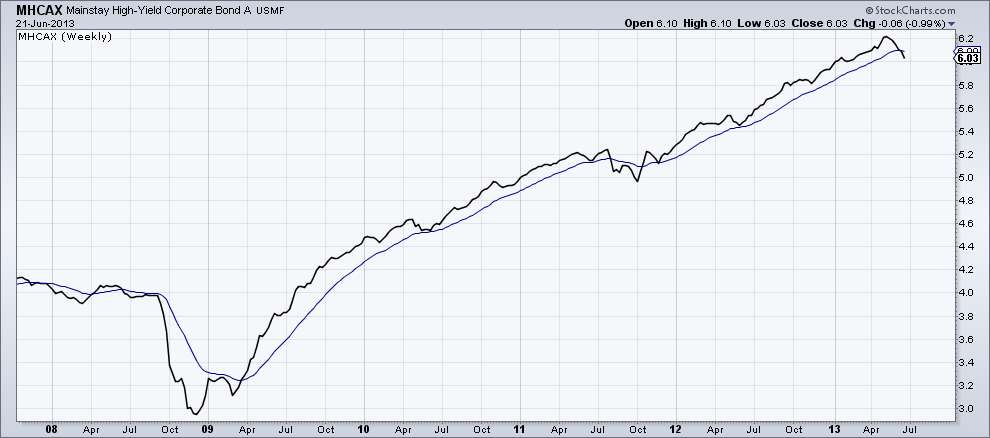
MHCAX is one of the indicators I follow to see where the market structure is. I have an intermediate moving average scaled. Right now, this indicator is in an intermediate sell signal. After 2009, the only intermediate signal was in the summer of 2011. If you look beyond 2009 in the past, there are few times when this indicator whipsawed the hell out of followers. If you follow the markets ardently, you will realize that there is no holy grail. You have a set of indicators and watchlists to follow your game.
Visit StockCharts.com to see more great charts.

GE is one of my indicator. I outlined previously that 22.75$ is my line of difference between bull and bear. Right now, we are (almost) there. Not quite. I expect some bounce here and then go down, no guarantees. We could go down from here as well. Either way, we stay short of SPX below 1590.


Market update

ST - Bearish
IT - Bearish
LT - Bullish


Thursday, June 20, 2013

Just the beginning....

The 1st serious dip below $1600 was vigorously bought. Nobody took the dips around $1700, nobody bought. Everyone wanted to be smart in their own right. The price was in a box for several months between ~ 1550 to 1800 for several months. Everyone had it in their mind. So, the wait finally materialized when Gold dipped below 1600$ this year in April. Many people I know seriously bought at a discount price of 25%. Whoever missed buying on the 2008 dip. On the 1st dip. They were actually waiting for 4 years to be smart. Within 2 days, sellers were out of gold coins. And selling at a super premium. Then comes the big shaft. Till 1320ish. I thought the 1300s would wait for a while. And rally to 1475 or so before going down again. But, last night the sell off was brutal once again. Down 5% in 2 hours. Now, Gold has a serious resistance at 1320$. Let's forget downside for a while. We are looking for upside, right? Just like I thought 1550s would pose serious resistance to Gold at 1300s, now 1320 poses good resistance if we look at the chart going back to July 2010. So, if we want the price to see an ascent to 1500$, 1320$ should break 1st.

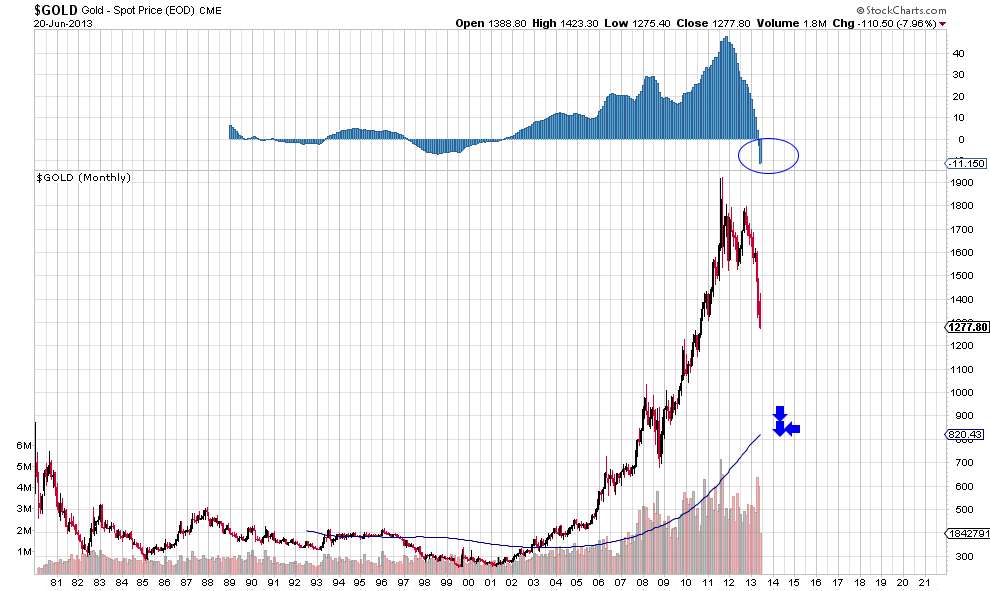
I am guessing 1200s should hold for a while. Knowing the "Spiking slow and falling hard" theory, I wouldn't be surprised if 1200 breaks down. And I know you don't mind, because you stood staring (without selling any of your metal) all the way up and you will do so on the way down as well. To be honest, I planned to sell some of my ornamental gold above 2,000$. But, it never came. See, I had a plan. So did many others who held gold coins. I never had any "gold coins" but just ornaments and paper Gold. I trade paper Gold on a regular basis but the ornaments' sale never fulfilled. I will have to wait till the next big cycle. Well, I won't live that long, so no worries anyway. When Gold dipped below 1600, many people said it was just the beginning (of the bull market), so let's buy more. It turned out to be the beginning, but of the bear market. Chart below shows that, read the circle. 

My indicator tells me that we are in the beginning of a bear market, with the 1st tick below 0 occurring in May 2013. Many pundits define a bear market as a price below 20% off the highs, so my indicator does satisfy that technical definition too. For the good of the bulls, I hope the parabolic rise holds, I want to see atleast a touch of 1500$ from below. But, seriously, if I have to be honest, I see a meeting with the blue line in the next 12 months at 900 - 1000$ price. If Gold price waits that long, that is. Because somebody wants to see Gold lower sooner and in a hurry.....


Please help me by copying the message "ditto" to silver traders as well.


Wednesday, June 12, 2013

Market update

With widespread panic going on right as Nikkei futures at -6%, All ords taking out 2013 lows, I think it is time for a timely update. On May 21st, this is what I thought. I suspected volatility, but definitely not a 5% correction at the time of the post. But, knowing this pyscho market, I was mentally prepared. The next day, ofcourse, gave us a clear indication and I planned accordingly. Bar few trades for meagre profits, my account has been mostly closing positions in the last 2 weeks. As of now, my account is 100% cash as indicated in the post outlined above. The chart that called "the top", where is it now? I am sure you are super curious. Are we at a bottom? I don't say that till this chart confirms. Unfortunately, it confirms at the end of the day and almost at the end of the after hours. But, based on the close, I initiate positions the next day. I suppose that has been working okay for me. I would say we are almost at a tradable bottom, but I definitely need price confirmation to say that. Based on the trendlines, I have 1616 - 1623 on $SPX as price confirmation on the hourly close. I will initiate market longs above that price. I will not short above an hourly close of 1590 on $SPX. If SPX closes below 1590 on the daily chart, then the intermediate outlook will turn negative as well. There is absolutely no need to undue take risks with this year being so good so far. Ok, now, coming to our chart, I have the indicator on this chart hitting the upper extreme where it had called for a bottom several times in the past 15 years. Beware though, if it decides to go extremes, like in summer of 2011 or 2012, you will be cooked. Hence, you need to have a price confirmation for a reversal. Till then, I would be happy to sit out and enjoy the sun.


Market update

ST - Bearish
IT - Bullish
LT - Bullish


Friday, May 24, 2013

JCPenney Inc.

 
JCP tried to push higher today but failed to breakout suggesting that there is a need for more work. The Intermediate term is bullish, no damage done. If you already have a position, hold it for higher. If you want to enter the stock, wait for a breakout (stop $18.3) 4hrly/ daily close or wait for 18.5$ (stop 17.3$) . No shorting this ticker, that's what I see! 

Thursday, May 23, 2013

Market update

I posted "short term top" post 2 days back. I hope you read it before the bell yesterday. I was not surprised by the market action yesterday, not at all.
 
 
Visit StockCharts.com to see more great charts.


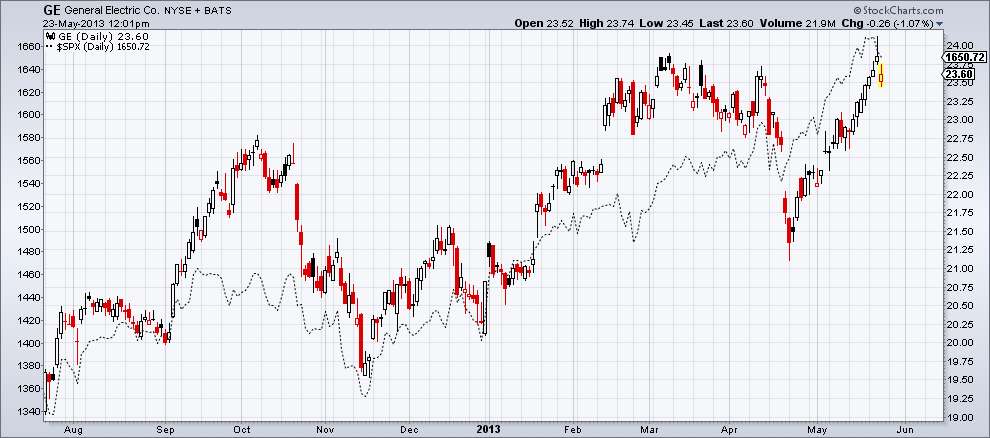
GE is one of the key stocks that market timers follow to time the tops and bottoms. I made a post on the market when SPX kicked 1600 level upside, that 22.75$ was the area to watch on GE. GE has done quite well to hold the level and pushed upwards. If you watch the overlay in the chart below, SPX made new highs in the last few days but GE is merely struggling against the March 1st week high. That to me is a divergence, atleast in the intermediate time frame.

 
The difference would be clearer on individual charts of GE and $SPX. Both GE and $SPX posted ugly candlesticks yesterday which indicate atleast a short term top. What would invalidate the short term top call? A close above yesterday's highs for both GE and $SPX.
 
 
What will confirm intermediate term top? GE closing below that yellow box.
 
 
What is our course of action right here? I have been fully long the market going into yesterday, although we had a caution before yesterday. I didn't close any longs yesterday. Today as I type this note, the market is still down but I am reducing my short term long holdings. On a further rally tomorrow, I will close more longs. If the tape pushes above yesterday's high and closes on a daily basis, I will add the closed longs. Long story short, I am still long. Anyone who has been long this year from day 1 would  still hold long. Why? Market is still up 16% at this time. I will close all longs on a close below 1620 SPX which means our portfolio will still be up for the year. I will go short below 1590 $SPX close.
 
I could go short on a very short term timeframe, but I would not advocate that to my readers - only because we cannot manage individual portfolios.
 
Market update
 
ST - Bearish
IT - Bullish
LT - Bullish


Tuesday, May 21, 2013

Et tu, CPCE?

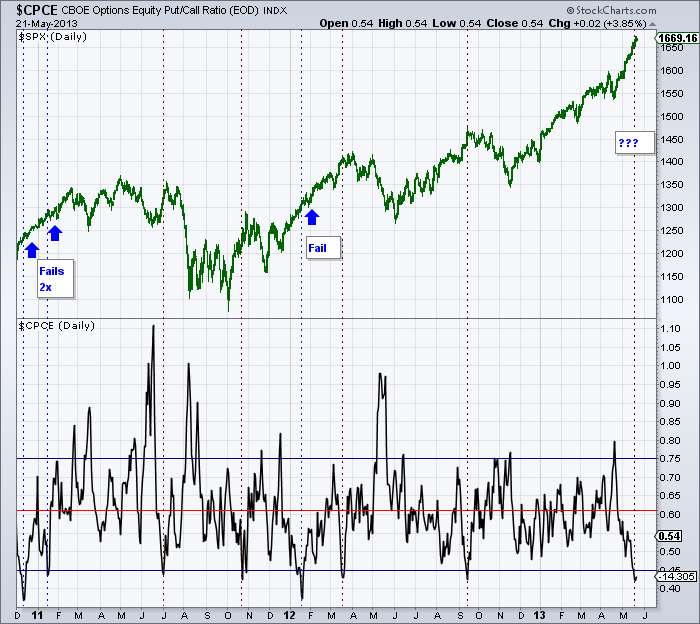
One of our reliable indicators for market tops indicates a top here. But, you look close in the chart and see failures are not uncommon for this indicator. 1, More analysis of the market suggests to us that market top still has time (may be 3 - 4 weeks). 2, But, be warned, 'coz this may be it. Either it is case 1, or 2, we are definitely going to see some volatility right here. Still staying long the market right here with wide stops. Nothing to lose for those who played along with us. You might be thinking that my last post was 2+ weeks back and I am bragging of some play. To be honest, when VIX is at 12, you don't "play" everyday swings. You just set the account on cruise and sit back. I hate to trade when VIX is low, it is a waste of time. Swing trading is better. I guess you got the gist of my post. Long story short, I see some volatility right here but market top has some ways to go. Nothing guaranteed, but use this as a guide.

Visit StockCharts.com to see more great charts.

Saturday, May 4, 2013

Is this a start of a new bull market?


There is excitement in the air. The mood in the media is exuberant as the media cannot stop about this joyous moment. Few of my friends who have no interest in the capital markets called me to confirm my positions. The above pic says it all.  Was this rally due to real economic growth? Or was it due to FED's actions? I could care less about the reason. All it matters at the end of the day is banking coin in the portfolios. Hence, my earnest congratulations to the bulls who played this market rally! As soon as the market hits new highs, everytime a question crosses our minds. Is this the beginning or the end? Should we cash in our chips or should we push new money into the rally? 

At our trading pits, we follow some important indicators to mark the market turns. One of them is bluechip stock GE. GE is one of the stocks that almost always shows signs of exhaustion (ahead of time) in market rallies as well as bottoms.  

Visit StockCharts.com to see more great charts.

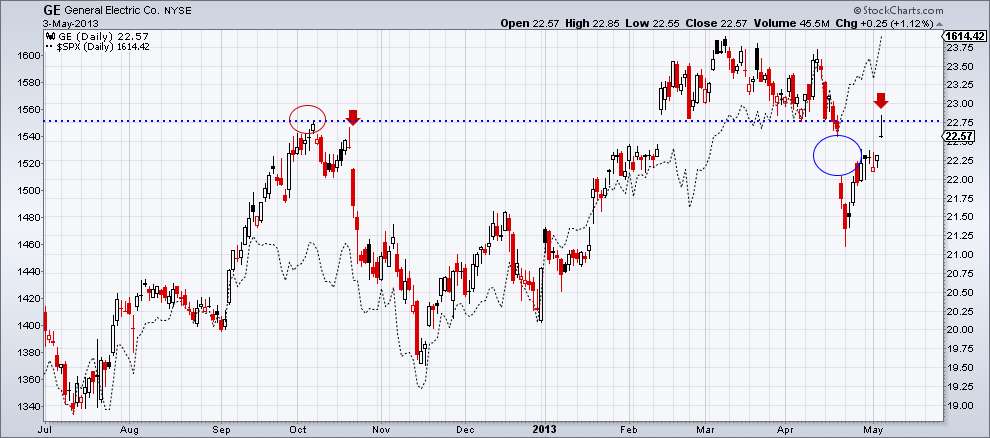
GE marked the top after almost every rally since 2003 in all time frames. My line in sand to be cautious was break of the Oct. top. That happened few weeks back was on not-so-good earnings number from GE. Since this market can simply run on fumes, I expected a vicious rally and that is exactly what happened. The market hit all time highs today on both the benchmark indices but one of our key leaders is struggling and has diverged from the market in the last few weeks. It indicates to me that leadership is diminishing, check AAPL, BAC, IBM etc. And, on a day like today when the market all time highs, I was surprised to see GE to print a big doji. There is high probability that GE is signalling to us the beginning of the end of the market rally, at least in the IT time frame and the rally from Nov. 2012 lows. 

I would not jump to a conclusion right here and say I am shorting this market on a massive fashion. I am merely cautious here. Irrespective of how many indicators you have, you must realize that the price ultimately talks. I will be looking for 2 numbers 1, If GE can continue above 22.75$ and 2, if the market can continue above 1590 SPX. 
Obviously if GE can push above 22.75$, there is no reason to doubt this rally. If GE cannot find its mojo to push above that line, I suggest you to be at the exit door. The previous high of SPX was 1597. That should be your typical market stop but given the ability of this market to run stops and shake us out, I will be wary to have a 10 point stop below that number. 

Right now, I am a cautious bull. Market topping is a process. It will take some time for the market to end rallies like this. I will enjoy the gains as long as the rally continues but I will be very flexible to change my position and short it. The exit doors will be crowded, so there will not be time to get out of the market, if this is the end of the rally. So, don't expect others to manage your positions on a minute by minute time frame. Good luck!

p.s: I made a market top post days before the previous (Sept 2012) top. Based on my assumptions, we thought it was the end of the bull market from 2009. There were indications of exhaustion but I also gave hints on what would make this long term rally continue. As I expected, this market topped but only on the IT time frame and not on the LT. We shorted the market around Sept 2012 high but we also reversed our position in Nov. 2012. 

Monday, April 29, 2013

Market update


Visit StockCharts.com to see more great charts.

VST - Sell
ST - Hold (Buy since April 18th, 2012)
IT - Bull  (Buy since Nov 27th, 2012)
LT - Bull (Buy since Nov. 2011)

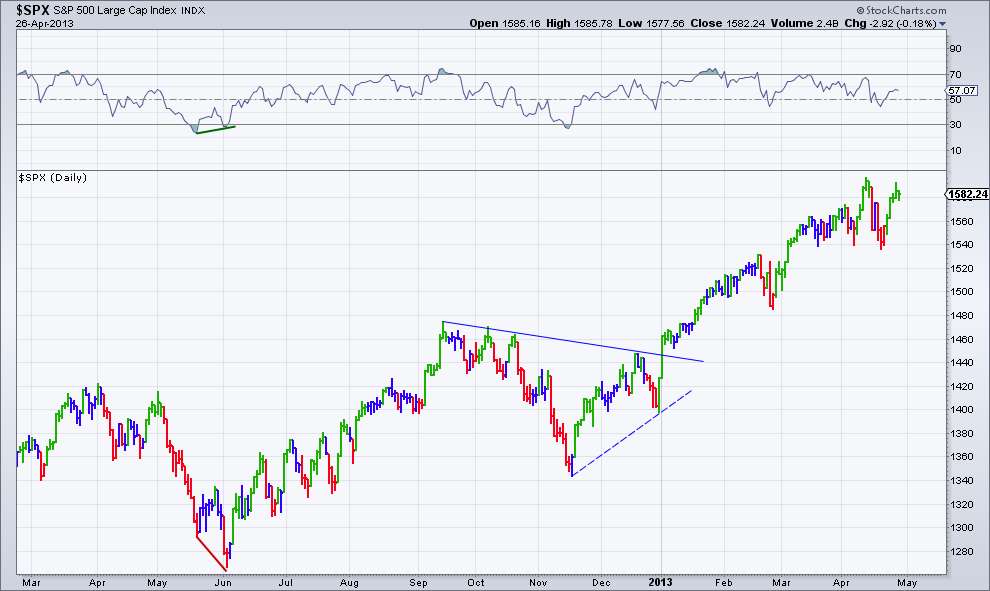
We should see ST signal to sell in the next few sessions. Just FYI, that triangle breakout at the beginning of this year should take us to a target of 1620 $SPX.

Friday, April 26, 2013

Amazon, Inc.

Closed AMZN short from more than a month back for 7.5%. Will short again at higher prices from here, if the stock rallies.


Good luck!


Polycom, Inc


Visit StockCharts.com to see more great charts.

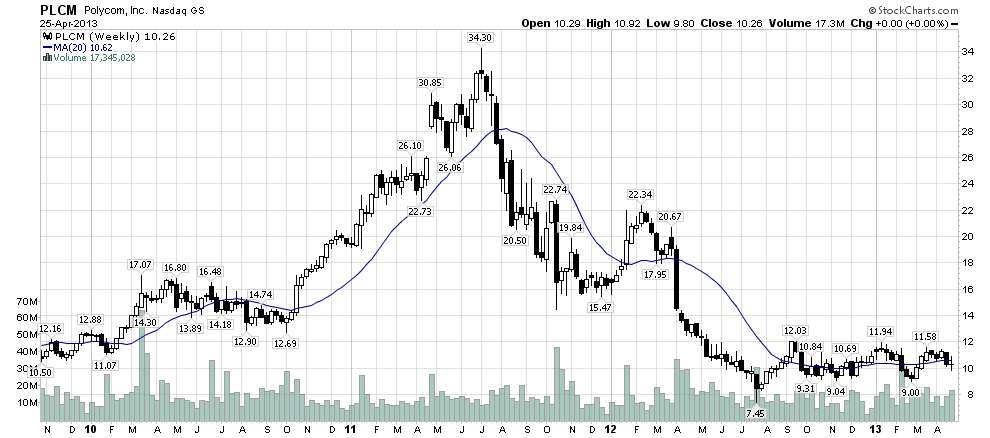
Stock trading between 9 - 12$ range in the last ~ 1 year. PLCM is on my watchlist. No positions right now, bias is to the downside but will be ready to trade either way depending on breakdown and breakout.

Good luck!

Thursday, April 25, 2013

Apple Inc


I entered long at 399$ yesterday. I will remain long, with 2% stops to my position. My 1st target is the 50 DMA. We will reassess later if any notable TA change takes place.

Health Management Associates

Visit StockCharts.com to see more great charts.
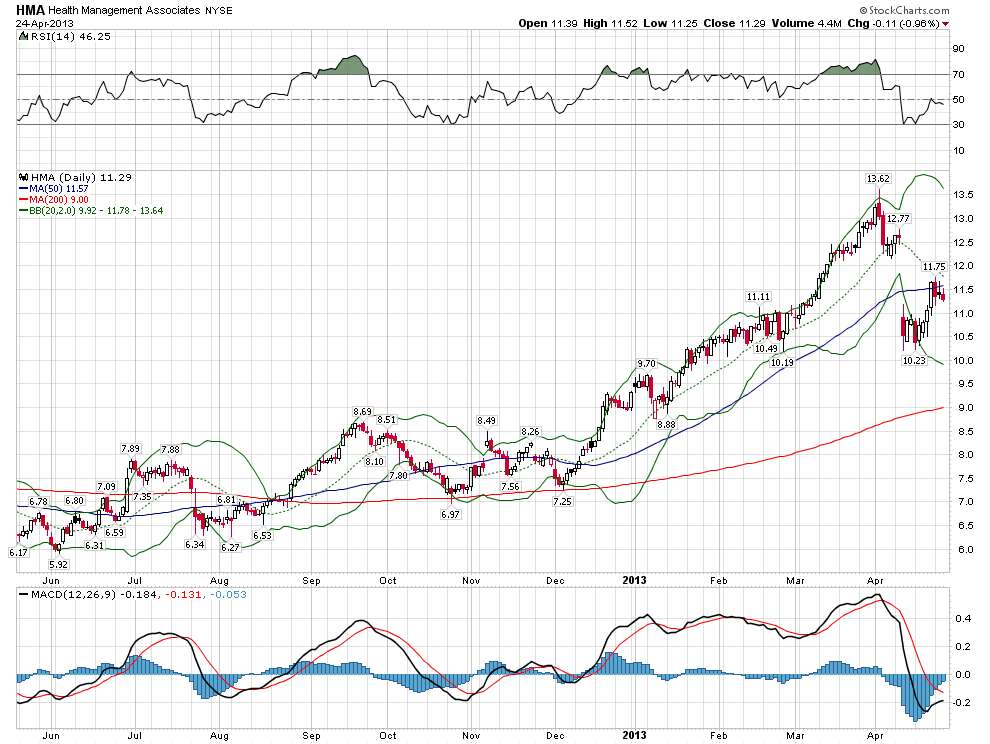
Recommendation: Sell short in the short term timeframe

Thursday, April 18, 2013

Verizon communications Inc.


The 47.5 - 48$ level should hold the support. VZ should bounce from there. You buy above that level and short sell below 48$. I would also look for a confirmation from CMF to dip below 0.

Recommendation: Hold, if you already have a position.

Thursday, March 14, 2013

AMZN


Issued a technical signal for short sell on the daily chart for AMZN

Tuesday, January 1, 2013

Portfolio performance 2012

Before proceeding further, I recommend you to read the Introduction for my trading activity.

For the calendar year 2012, net gain at Silver Ven Capital was 80% after commisions and other expenses. My 2011 performance was posted here (click link). Volatility was at low levels through 2012 though there were whipsaws all along. Trading was overall good in 2012, we continue to make very good progress. One of the biggest losses for me came from the plunge of KCG. I had to close KCG shares at a loss of 60% on overnight gap down. The good thing about this trade was I had correct position sizing, as a result my account had no significant impact. I rue such losses though, but we cannot expect such events. Hence, I always stress on correct position sizing for the account.

A, One of the first goals of 2012 was to reduce commisions on trading. Commisions for 2012 were 15% lower than 2011. I had a goal of cutting these expenses by 50% which I could not achieve. I plan to reduce the expenses more than 2012.

B, Another goal for this blog is to post my trades in a journal format for everyone to format. I plan to start posting my trades in real time on this blog in a spreadsheet within the next few days. Keep glued to this space.

I wish all readers a very Happy New Year 2013 and continued success!