Tuesday, April 29, 2014

Market update

Previous update here
 
VST/ ST - Bullish (turned now from bearish)
IT - Bullish
LT - Bearish
VLT - Bullish

Sunday, April 27, 2014

Gold update

Previous update here
 
VST/ ST/ IT - Bullish (Daily charts turned bullish on Friday)
LT - Weekly charts still bearish...
VLT - Bearish
 
 
Last many weeks gold has been chopping both bulls and bears.....

Friday, April 25, 2014

Market update

Previous market update here


VST, ST - turned Bearish
IT - Bullish, hold
LT - Bearish
VLT - Bullish
 
We have closed VST, ST positions earlier this week. We do not wait for the signal turns to close ST/ VST positions. Read our "Introduction" section above, for better understanding of our methodology. IT positions have a 3% stop from open. This ST bearish turn could easily become a IT bearish position, I will update when that happens. GLTA!


Sunday, April 20, 2014

Market update

Previous update here .
 
 
VST, ST - Bullish, hold
IT - Turned bullish as of Thursday's close (stop 3% below Thursday's close)
LT - Bearish
VLT - Bullish
 
We traded the gyrating ups and downs of the market swings very well. I, infact tweeted live all my moves. I expect the market to continue to be volatile, I expect much downside or at best choppy. But, since I will only take my signals and not let my bias affect my trading, I will disregard the "general talk". I will update any changes in the market directions. GLT All!
 

Saturday, April 19, 2014

Gold update

Last buy was at 1285$, check this update for previous comparison . We have been tracking that chart for several weeks now. I have had a Intermediate target of ~ 1550$ based on that chart and my signals. This week we had a turn on our IT and LT frames. I have a sell signal on daily and weekly time frames right now on Gold from a buy previously.
 
 
The best case for a bull right now is that we could be a in a chop. Unfortunately, I will take my signals. My stop is ~ $1,350. GDX is in a much worse position, BTW, obviously due to the recently sell off in the equities. 
 
All timesframes - Sell


Tuesday, April 15, 2014

Market update

Previous update here .
VST - turned bearish this hour
ST - Still bullish, losing steam
IT - Bearish
LT - Bearish
VLT - Bullish
 
GDX, GLD, /GC
 
VST, ST - Bearish
IT - Bullish but on edge
LT - Bullish (next update will be at end of week, last LT buy was at 1285 - /GC with a 3% stop)
VLT - Bearish
 

Monday, April 14, 2014

Market update

ST & VST & Very Long term - Bullish
Rest of the time frames  - Bearish


Saturday, April 12, 2014

Netflix Inc. & Tesla


From the above Fib sequence charts, it should be very clear what the 1st targets for the current trend are. TSLA had a slight overshoot in its frothiness at the 161.8. Trend change before the support lines? I highly doubt it. But, will keep you informed if trend changes. 

Friday, April 11, 2014

Questions and answers

I have had 2 questions from my stakeholders, very important ones: One was about GDX and another about yesterday morning's market update.

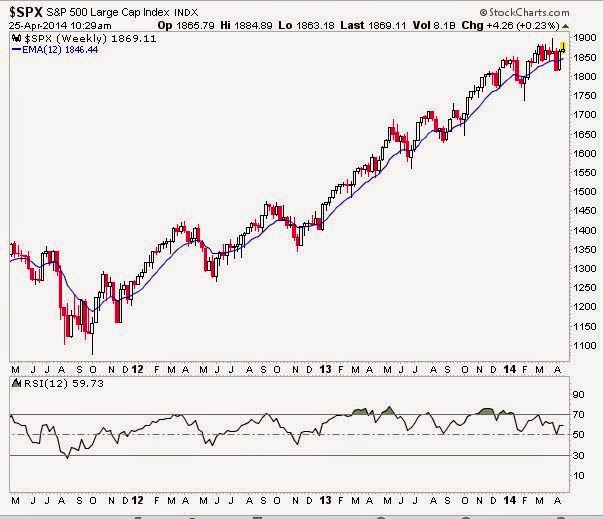
1, On Wednesday, my analysis indicated a buy signal for the markets. Yes, it did - based on the 4 hrly charts and the daily charts. My update also indicated a hourly sell signal. Absolutely contradictory. I manage 3 portfolios. One for the long term, one for the swing trading, and another for frequent trading. I understand your question, as soon as you read this - not everybody has 3 types of portfolios in their account, especially the small trader.  Unfortunately, swing trading (on daily charts) has not been very good in this "bull market". I could not beat the SPX last year, only because my swing trading portfolio underperformed. I am not alone in this regard. If you look at any hedge fund, they all say it is a tough market environment to invest. One day the market is up 2%, the next day down 3%, it goes on and on. Is the market moving so much in the weekly horizon? Not so much!!! But, for those of us who are trading the daily charts, it has been tough. Really tough. On the other hand, trading (on hourly charts) has been excellent, especially with these wild swings. The Intermediate and long term trading (weekly and monthly charts) has been very good as well. Unfortunately, that has been the name of the game. Anyway, right now as of market close yesterday, all timeframes except the VLT are on a sell.

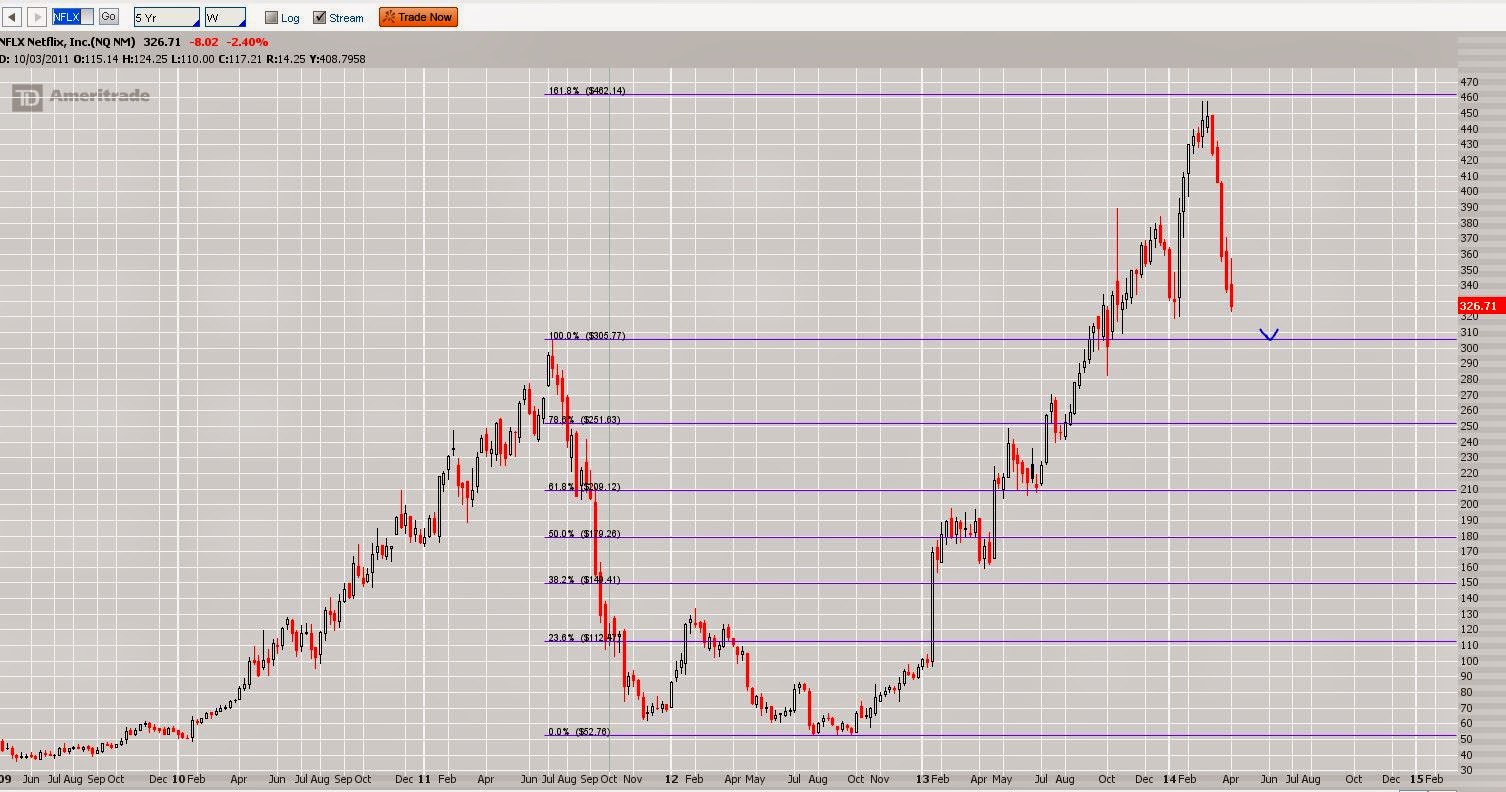
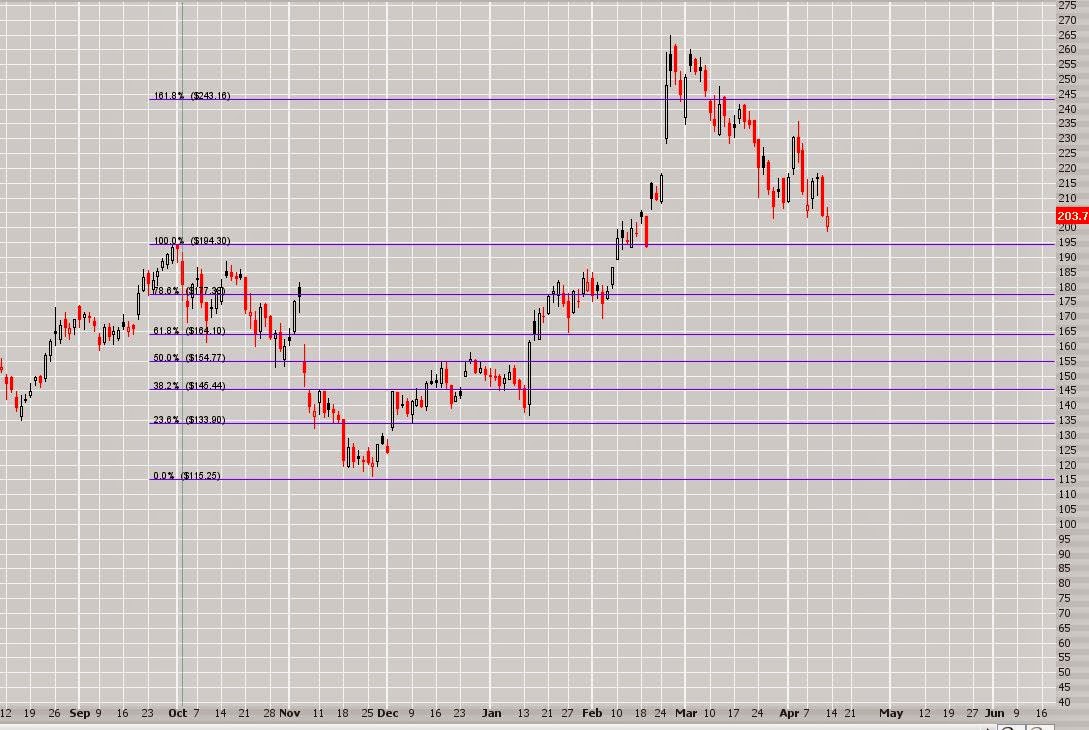
2. Someone asked me few weeks ago if GDX is better than GLD or viceversa. At the beginning of this year, I forecasted that both will outperform the market. And yes, they did (chart below). I have also noted that GDX will outperform GLD. Unfortunately, that has not been the case even while GDX has significantly been up for the year. The main reason being GDX is a basket of Gold mining stocks. Obviously, the stocks trade along with the general market trend. If market conditions are unfavorable to be bullish, and Gold charts are bullish, I would go with GLD or /GC (future traders). Not with GDX.

 With the market being brutal/ choppy, if you maintain some rules on a strict basis, you should still come out with gains from time to time.  Good luck again!

Thursday, April 10, 2014

Market update

Market update based on /ES & SPX
 
VST - Sell (based on current hourly chart)
ST - Buy (as of close yesterday)
IT - Buy (as of close yesterday)
LT - Sell
VLT - Buy
 
 
VST = hourly; ST = 4 hrly; IT = Daily; LT = Weekly; VLT = Monthly
These are my definitions, timeframes depends on volatility
 
Previous Gold update here . We are still nicely following the same trend, so I will post updates when trends change.
 
p.s: The earnings season is upon us. I would avoid earnings plays on individual stocks. I am not an earnings technician, I don't have the stomach for those gyrations. This is a nice time to trade the indices though, very manageable! Good luck!