Wednesday, December 26, 2012

ISRG update

Posted this on 12/20th . No change in stance, risk is to the downside. Holding short right now with stops. Current chart below on a weekly period, hence patience is required.


Friday, December 21, 2012

Gold miners

I short Gold miners via being long DUST. DUST is 3x bearish Gold miners ETF. I bought DUST at $27.90 and I am holding it as of now at 35.51$. I monitor my DUST position using GDX charts. I would be out of DUST on the break of my 17 EMA (indicated by "A" on the chart). I would consider buying a small amount of GDX on the 1st trendline break, for trading (short term). I would really consider investing (means holding in Intermediate/ long term) only on a trendline break above the 3rd trendline. Till these breaks happen, hold the shorts on GDX.

Click on the chart for bigger view


All 3x instruments should be considered trading tools only, 3x instruments should never be considered "hold" instruments or investing instruments. It is also prudent to have a stop/ stop loss on all such instruments. Good luck to you!


Thursday, December 20, 2012

Line in sand

Lol, I was typing this message with "lines in sand" chart but the futures puked down to /ES 1392. Well, currently /ES stands at 1418. Remember the flash crash in 2010? The lowest level on that day will be tested later. In other words, sell the bounce in the short term. No TA here, simple common sense. Now that you know we will visit 1392 again, get ready for it. 1417 is the current support level but that will be broken eventually in the coming days. I am looking at the hourly chart here but closing price on the hrly is important as well.

Tomorrow is OPEX, so if I was short I would ring the register at least on partial positions because OPEX days harass both bulls and bears equally.

These types of "crashes" also teach us not to be short options, though they may be fat tail risk events. Accounts will be wiped out in an instance.  


ISRG

Currently no position. I shorted at 537$, posted live tweet on stocktwits. I covered at 495$. The ticker broke the trendline on high volume and is staring at the long term trendline where it will find the bottom. Why did I take the profits? I rang the register because I rode the ticker down 8% in just 24 hours. It could still go down but taking profits is healthy for the account. I expect the ticker to go up, kiss the trendline and back down again.


Gold update

I am looking for a bounce here at this level. However, the damage is done. Sell your short term positions on any rally because we are going lower on Gold and silver. Intermediate and long term positions are still good. 


Saturday, December 15, 2012

AAPL update

Andy Zaky and Cody Willard who loaded on AAPL calls at 700$ and then 650$ on margin are as good as dead now from loading up to their gills. While Andy Zaky's last public post came on October 23rd, Cody Willard is now seen answering questions about the fundamental big picture on marketwatch like he is some expert on market fundamentals. Lol. Few days ago, I was having a conversation with a stocktwitser and he was saying Andy Zaky made a lot of money on AAPL in the last few years. Yes, they were rewarded from AAPL's long run for a long time by getting lucky but they frittered it away. Both levered it up many more times than they actually can, bought options on margin. Word on the street is Zaky is now unofficially bankrupt. People like them will continue to load it up on both stock and calls as the AAPL plunges and will get delivered by a big shaft named AAPL. They had no clue while it was going up, they will have no clue when it is going down. Every Tom, Zaky and Cody will be right in a bull market. It is them who survive the bear markets finally make it to the end. Zaky and Cody are not one of them.

Exactly when AAPL hit a generational low (sarcasm peeps), I posted this . AAPL rallied hard and then hard till 590$, everyone who proposed the generational low thought I was wrong.  If you read that blogpost well, I said there will be violent moves in both directions, long and short. I said fortunes will be made and lost. AAPL is a stock that cuts both longs and shorts. It has been that way forever, and it will continue to be like that. If you check market action of AAPL in the long time, between peaks and bottoms, you will find that it often cut itself into 1/2 or then double again. For example, in 2008 from 180+ to 110$ and then again to 180+ and then to bottom at 80ish. These type of moves happened even when the stock was in the teens. These will happen even now, except the volatility has risen now much more. Big gap downs and gap ups seem common. Most of the traders have no clue which way it goes. I have been making good money off of it, but I rarely hold overnight, mostly by trading intraday. I don't want to keep a loaded gun in my pocket while I am asleep, nope. Traders have no clue, then investors don't have any idea what investing is. Yes, some of them have made 1000%+ gains in the last decade but what is the use if they don't make it to the bank. They are clinging to their positions thinking that the fundamental big picture is excellent. Apple as a company will be here (I hope so!) in the next 10 years just like Microsoft but as a stock it will underperform in the long run now. Law of averages will catch up eventually. 

I am still clinging to my 'generational low' post even now. We are yet to see a bottom in the intermediate term. The gravity is too high and the stock cannot sustain here. New intermediate lows are coming. My only hope for the bulls is for the stock to bottom in the 490ish range where the monthly 20 MA sits. Of course  the bottom would not complete till the ticker hits 430ish. But, first 490$, then upside and then again start the move lower. That will kill both longs and shorts, get it? Yep, bear markets kill both bears and bulls because moves will be violent in both directions. That is why market veterans ask us to be in cash in bear markets, and they are true for a reason. That is it for now on AAPL.

Market update:

VST - Bearish
ST - Bearish
IT - Bullish
LT - Bullish

Use SPY/ DIA to play my market updates. QQQ is out of sync due to the AAPL fiasco.


Tuesday, December 11, 2012

Market update


The market has been waiting for some "crucial news" from the fiscal cliff talks and then tomorrow's FOMC announcement. The transportation index has been in a box for over 6 months now. Which way does the market go depends on the DJT moving up (breakout) or down (box trading again). I am watching this as we trade the markets. Currently, my targets are almost achieved on the VST and ST. I am neutral on these timeframes now. I am bearish on the Intermediate term. I am bullish on the long term of this market.


Update on Intel Corp.

I posted this chart few days back on my buy on INTC. Now, INTC broke that downtrend line. Holding long and strong with a 1st target of 23$. Stop at 19$.
Visit StockCharts.com to see more great charts.

Saturday, December 8, 2012

Bombay stock exchange

The BSE has run over 8% in the past 20 days and is over extended. The market is trading on negative divergences here. While I envisage that this market will reach a peak by April - June 2013 and then down from there into 2014, my short term view is bearish. This market needs to correct here in order to go further up. I expect the market will find support at the 50 DMA to take pause. Charts of Indian ADRs also show the same TA, divergences all over. My recommendation is to sell short IBN, HDB, EPI, IFN in the short term. HDB and IBN are Indian bank ADRs while EPI and IFN are ETFs based on the BSE/ sensex. 

Visit StockCharts.com to see more great charts.

Friday, December 7, 2012

Tuesday, December 4, 2012

Weekly NFLX chart

Bigger short squeezes coming.....on capital gains covering! Long from 83$.
Visit StockCharts.com to see more great charts.

Intel corp.

Bought INTC here at 19.7$. You can buy the breakout of the green trendline.
Visit StockCharts.com to see more great charts.

Shanghai composite index

Shanghai composite index is showing a positive divergence in the Intermediate term. A break above the trendline can be bought. Remember this is a weekly chart, so it may take few more weeks for the breakout. Be patient! You could buy FXI to trade $SSEC in US markets.


Monday, December 3, 2012

Saturday, December 1, 2012

The big picture


The long term trendline of $NDX from the lows of 2009 is still intact. There was an attempt to break the line on 11/16. The index dipped below the line but closed above it. The momentum is waning with all the indicators posting lower highs. But, if you are a long term investor, you could wait for the trendline break and then a 5% stop below the break, to exit.

Even after the trendline break, there will be attempts to rise above the trendline again. All this may take few months time. Topping is a process as you all know. I see $NDX topping in this short term at 2725 - 2750 but then there will be several attempts to regain the momentum. In other words, we could see a range bound market for the next several weeks.

Either way, long term investors have no reason to get out right now. If the momentum is very strong, we may even rise above the 2012 peak. There is a very small possibility for this to happen, but there is!

My previous big picture call was posted on September 3, before the market peaked few days later. So far as long as the market doesn't rise above it, it remains the top for this market.


Friday, November 30, 2012

WFT

Sold short WFT yesterday before close, IT trade
Visit StockCharts.com to see more great charts.

Thursday, November 29, 2012

YUM


Bought YUM at 69$. For a flip trade.


UNG

Sold short UNG. Reckon the winning trade of the year has turned. Soon expect to break that trendline.
Visit StockCharts.com to see more great charts.

AAPL VST

Negative divergence on the hourly charts between price and oscillators. I expect the price to drop from here. The daily momentum is up, the weekly momentum is down. I will buy puts when that circled indicator turns down.
Visit StockCharts.com to see more great charts.

TIF trade

Bought TIF in premarket at 56$. Stops at premarket lows. Looking for a flip, but the chart looks good for a buy in the IT.
Visit StockCharts.com to see more great charts.

Wednesday, November 28, 2012

SINA

Sold SINA today morning. Holding short SINA in the Intermediate term. Look below for the market update posted earlier.

Visit StockCharts.com to see more great charts.

Market update

VST Bullish
ST bearish
IT bearish
LT bullish

...based on $SPX. Trade with $SPY

Friday, November 23, 2012

Market update

Previous market update is here

VST remains bullish but could get a sell in 2 days
ST - bearish
IT - bearish
LT - bullish


Thursday, November 22, 2012

Wednesday, November 21, 2012

NUAN

Selling short NUAN, stop at 22.5$. The 19.5 - 20$ support should break eventually.
Visit StockCharts.com to see more great charts.

GOOG


I believe GOOG counter trend rally is over. In the next few days, GOOG will either post a low at the 11/16 or lower than that. No positions, just interested in watching.


Visit StockCharts.com to see more great charts.

Tuesday, November 20, 2012

AAPL - MACD crossed up today

My previous post on AAPL, that is for intermediate term outlook, no change right now on that opinion.
Visit StockCharts.com to see more great charts.

Intermediate trend remains on a sell, sell all rallies into it. You will see a lower low below $505 and several lows in few weeks - months.

Sunday, November 18, 2012

Ringing the register - capital gain taxes

Investors have been puzzled why the (supposedly) best tech stock in the world AAPL has entered the bear market territory recently. One of the thesis that has been floating around is, long term investors are locking their profits after a tremendous 3 year run. On the other hand, stocks like RIMM, FB which have been on the losing end have gained in the last 2 months. How come? Investors who have been long the winning stocks are closing their positions by selling, while investors who have been short the losing stocks are closing their positions by covering. A strong reason to believe this is probably an increase in capital gains taxes next year. The 1st chart shows YTD run in all the highlighted names.
Visit StockCharts.com to see more great charts.

The 2nd chart shows the performance in the last 3 months.

So, should you be loading on the winners, after this 'sale' is over? If you believe the strong fundamentals are intact, you may do so with caution. But, I insist that you exhibit a fair bit of caution in buying stocks whose technicals have been severely damaged like this one. Damage to the technicals in a stock will skew the view of investors, no doubt. Till the time the technicals are corrected, you may stay away from those stocks.

I included Homedepot HD which has been up a good % in both the charts, despite selling seen in other names. HD is sound both technically as well as fundamentally. In ideal case, given the ongoing market correction, I am not suggesting you to go long any stock right away. But, should the market rally after the market internals rise, names like this would be the 1st on the radar.

Saturday, November 17, 2012

Market update

Market update is typically given for $SPX. Use $SPY to trade the market. 

VST - Bullish
ST - Bearish
IT - Bearish
LT - Bullish

Emerging market's have been outperforming the US markets for the last 2 months now. Recommendation is to short the Qs and go long the EEM. Since September, this trade netted 10% +. I believe the same trade will continue to outperform in the very short term (VST = 3-5 days) and the short term (ST = 20 - 25 days).


I posted AAPL's outlook for the next few months last night, don't miss to read it.

Friday, November 16, 2012

Fortunes will be made and lost - AAPL

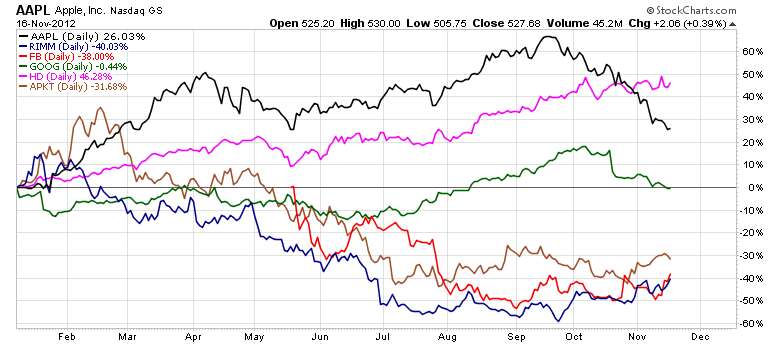
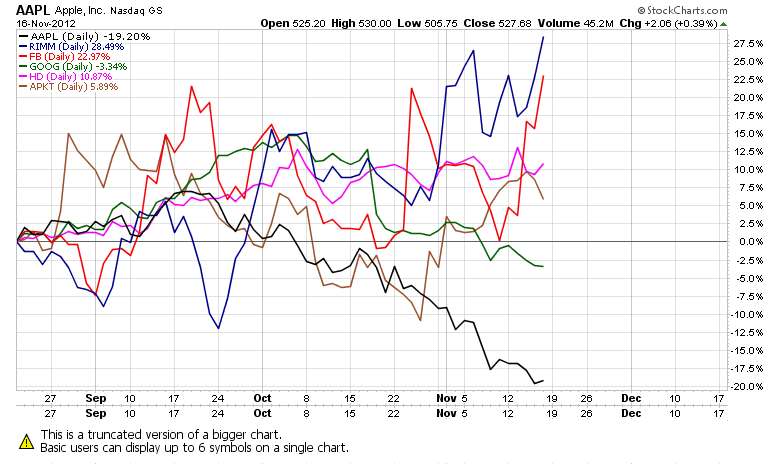
This is wallstreet. Fortunes are made and lost here in regular and tandem fashion. That is no surprise. We see a dot-boom go bust with high degree of periodicity. AAPL as a stock is up 30% YTD. That is not the full story though.  It was up about 74% about 2 months back. It retraced 25% since it's Sept high of $704. That is still not what bothers me. The velocity with which it is sold incessantly, despite being the global innovative leader in a bunch of leading electronic devices, holding 100s of billion $s of cash in hand, solid reputation at stake is what makes me think deep. Something is wrong behind the curtains. Also, it is easy to justify the high market cap when the company is at its prime, people realize the problems only when the stock goes bust.  While we don't yet know what that 'something' is, our charts show that the ticker is very very disturbed. It is often said that the stock market is often a reflection of behind-the-scenes action, I can't comprehend what I am seeing. Wall street is brutal and doesn't care for reputation, innovation or leadership. 

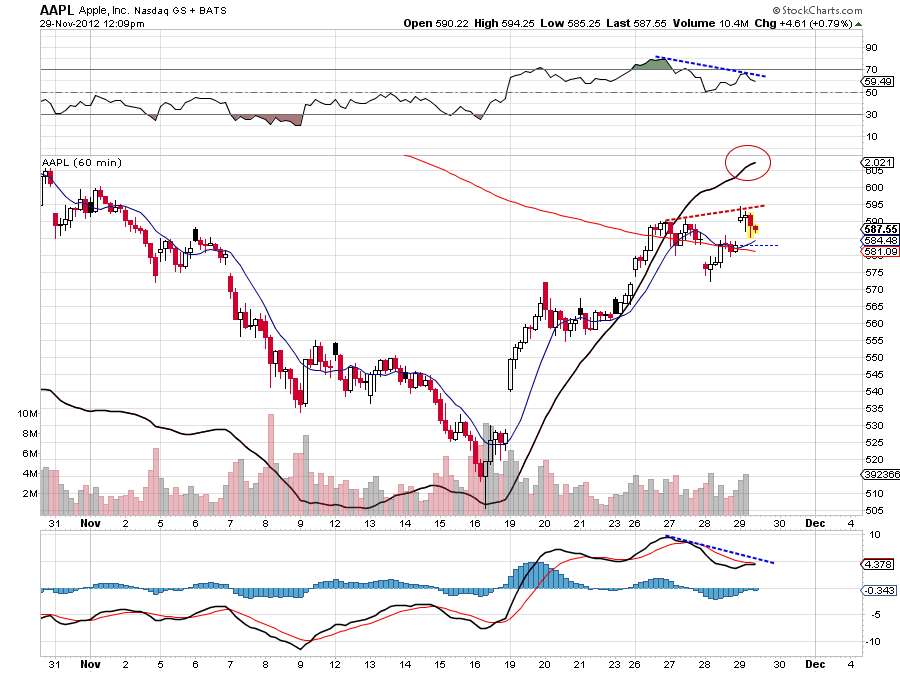
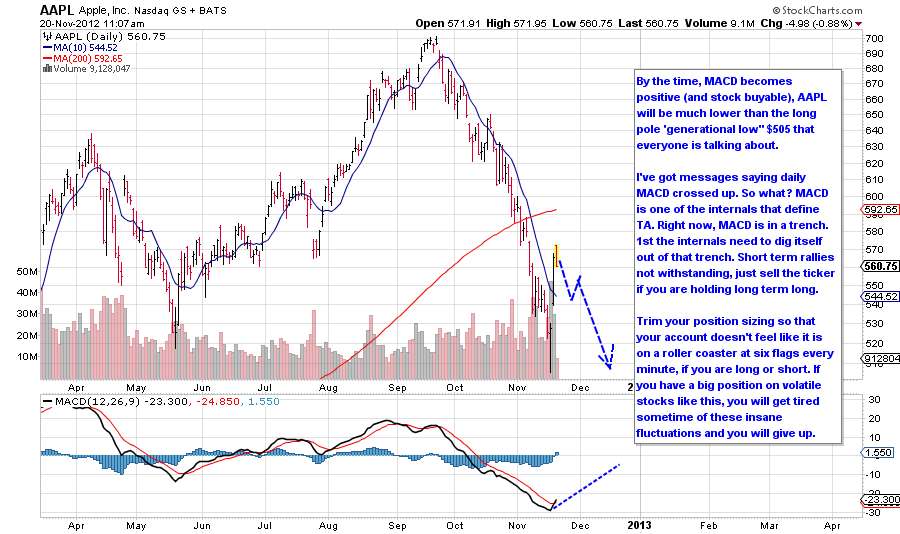
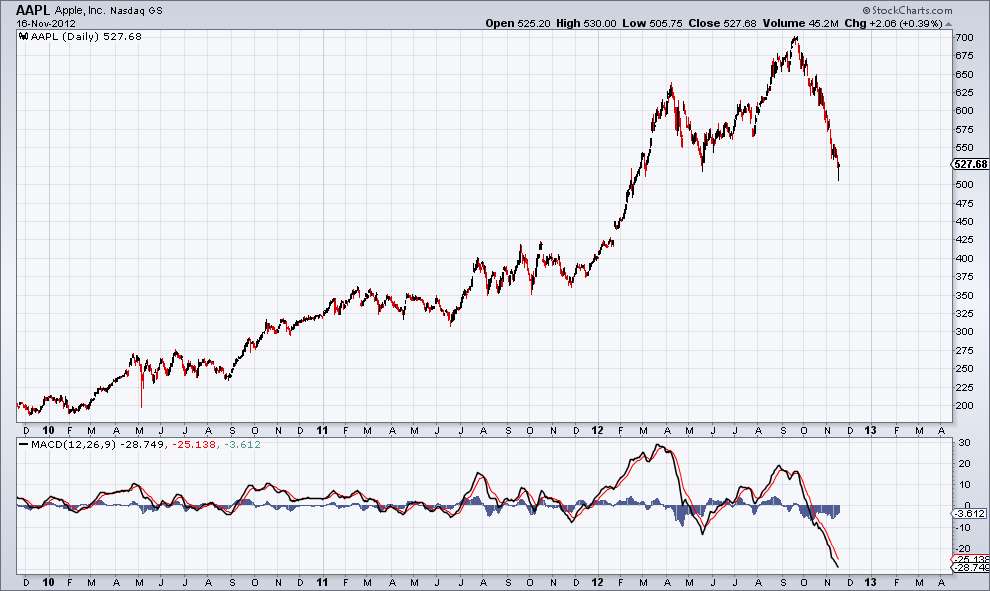
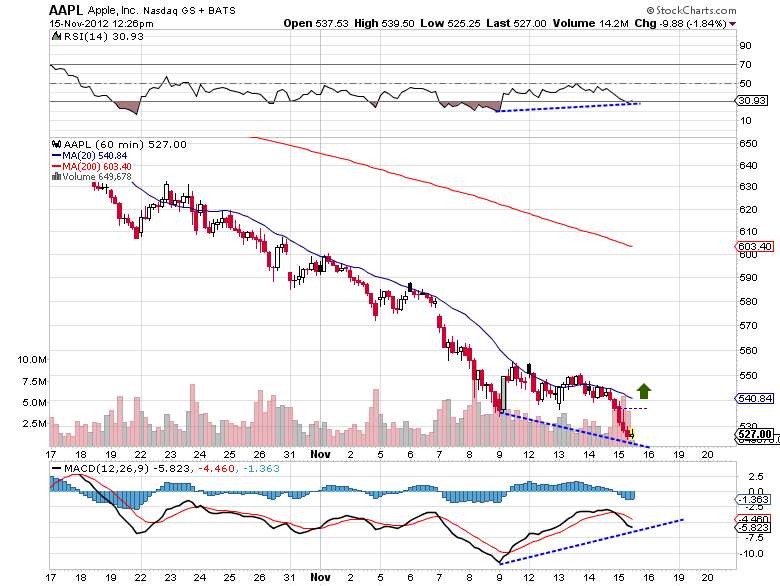
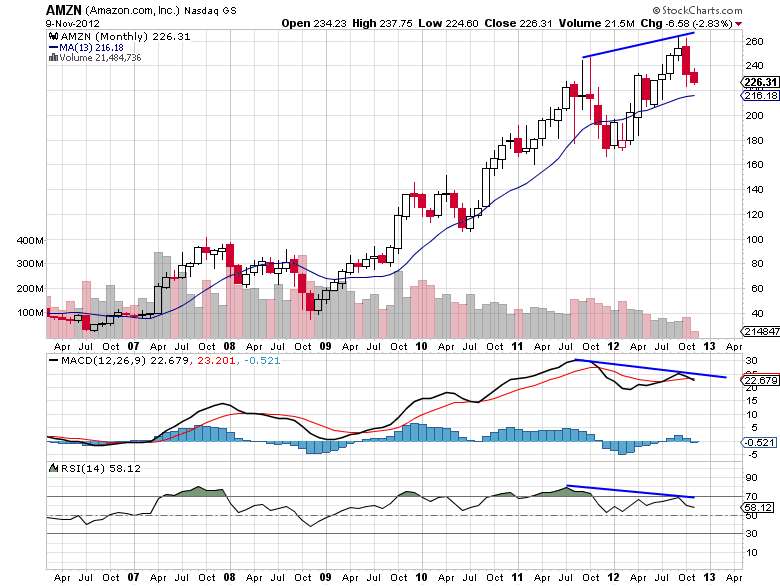
For comparison, I have summoned the great dot-busts from the 2000 stock bombs. I looked at almost 100 charts of tickers including YHOO, MSFT, AMZN, PCLN (all of which still exist, only with a minuscule of their stock's prime valuation) and then some tickers which don't exist like BCOR, NVTL. I noticed that in today's AAPL chart, the MACD indicator is extremely oversold. A bottom or top in the MACD indicator never ever occurs simultaneously at the same time with the price of a ticker. Usually the MACD indicator tops or bottoms and then days-months later the price bottoms. Sometimes years later, in extreme cases like this. The MACD indicator has gone below - 25 which we rarely see. It often indicates violent plunges are ahead. There may be short killer rallies in between but these kind of stocks with extreme monstrosity are hard to predict and more often than not end up losing most of the market cap. I know, it is hard to imagine AAPL going bust with virtues as underlined above but this is wall street folks. You could create history or you can be history riding AAPL from here. 

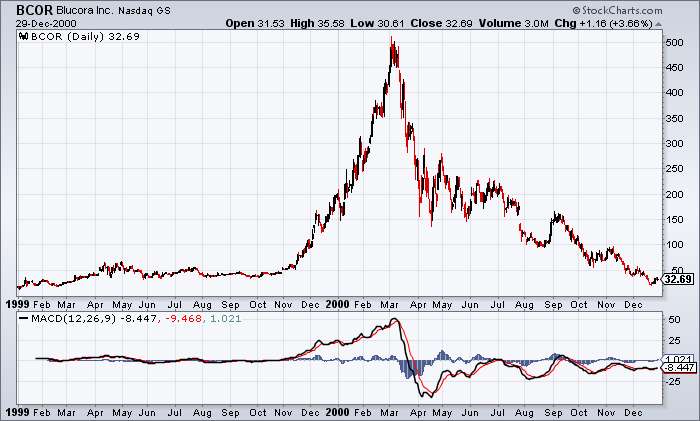
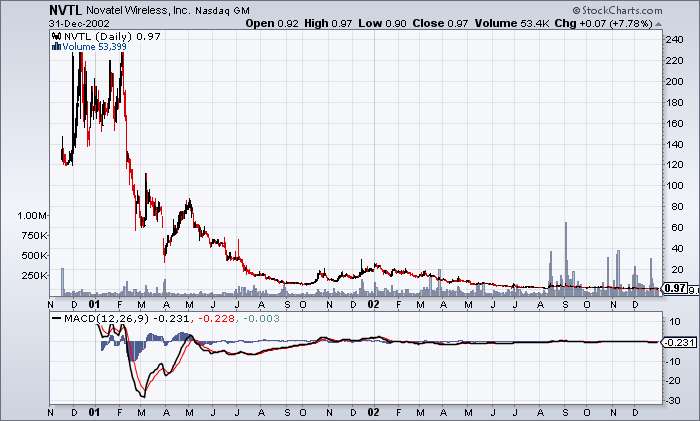
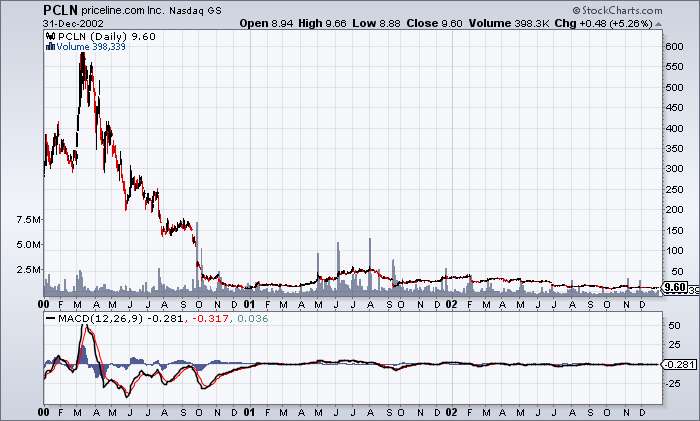
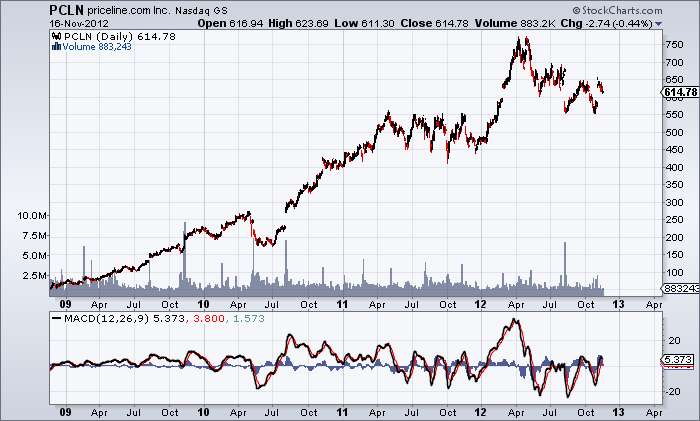
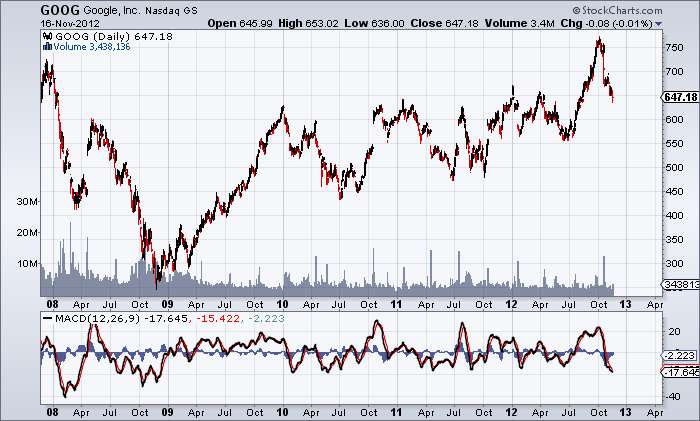
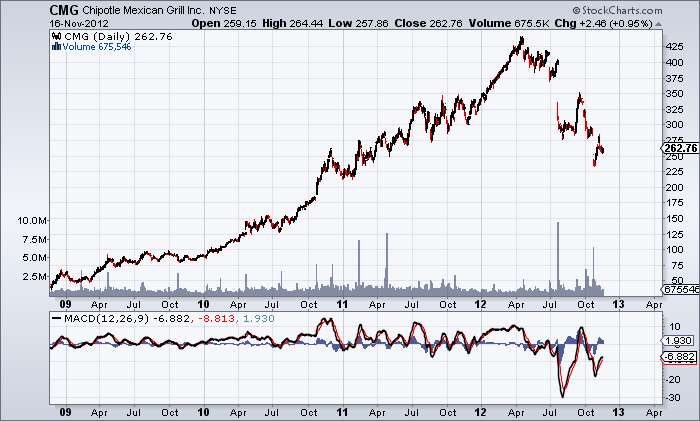
I am including charts of BCOR, NVTL, PCLN from the dot bomb era, GOOG and FSLR from 2008 market crash, PCLN and CMG from the current era from the comparison with current AAPL's chart below. BCOR, NVTL went chapter 11 while PCLN recovered. PCLN continues to show the same violence with precision every year in its charts. CMG is the latest example of one high flying stock which has gone bust in recent times.

Bottomline is -  All time top in AAPL is in. The bottom of short term, Intermediate term or long term is not yet seen. Extreme and violent moves on both directions will continue in the months ahead. I am reading several posts of 'V' bottom. Yeah, right! It is not that easy, folks! Bookmark this post and we will meet in 6 months. 

In the charts below, concentrate on MACD extreme reading and what fate followed  for each ticker ahead

Current AAPL


BCOR from dot-bomb era


NVTL from dot-bomb era


PCLN from dot-bomb era


PCLN current chart


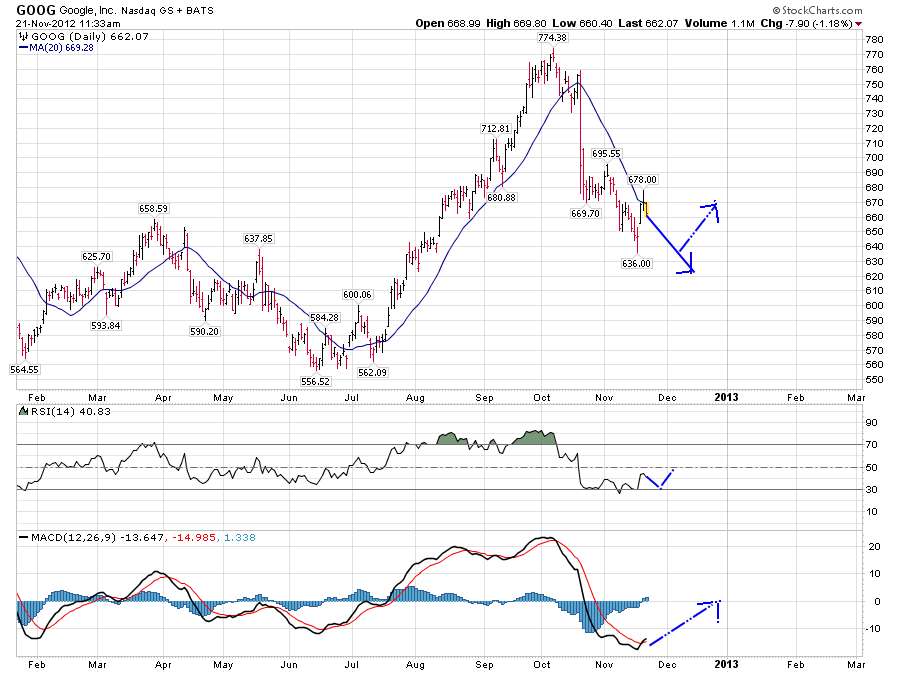
GOOG from 2008 crash
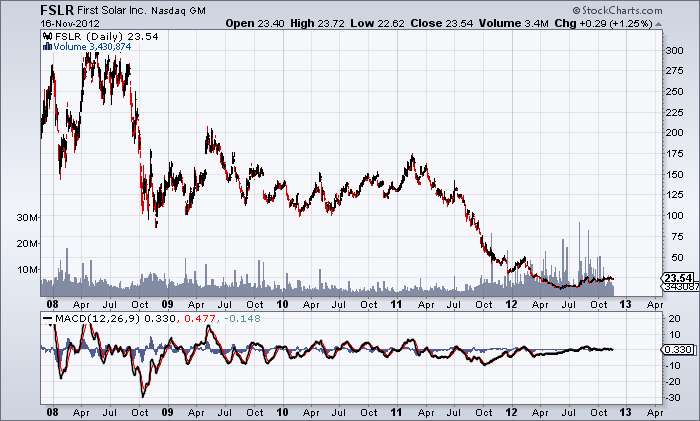


FSLR current


CMG current


AAPL current


Thursday, November 15, 2012

AAPL divergence

As simple as it gets, there is + divergence between indicators and price here. Price = lower low, indicators (internals) = higher. I would wait for the turn up in the indicators. Will add more on the break above 540$. This is very short term trade based on hrly chart. Place appropriate stops, don't forget it.

Visit StockCharts.com to see more great charts.

Tuesday, November 13, 2012

NFLX

As simple as it gets, NFLX breaks out on the hourly chart. Atleast the posture looks like so after consolidation of few days. Right now, as I type, the ticker is back in the channel in thr next hour candle. Apparently the volume is on the light side, breakouts of low volume doesn't last. Nevertheless, keep this under your watch list and buy on a confirmed breakout with appropriate stops. I believe that the breakout is to the upside. Should it be lower, short the ticker.


Sunday, November 11, 2012

AMZN long term

AMZN peaked for the long term. The ship is going down. For this theory to be invalidated, AMZN must clear 250$.
Visit StockCharts.com to see more great charts.

Market update

Previous market update here .

VST - bearish yet, I don't see any signs of buy in the VST yet. Will update at the next instance of a buy.
ST - remains bearish
IT - cash
LT - remains on bullish signal

Saturday, November 10, 2012

Using moving average cross-overs for $VIX

It was widely expected that the removal of uncertainity after the presidential elections will move the $VIX sharply down. After the elections, $VIX didn't fall. $VIX has been very stubborn, in fact. The results of the elections met with market sell off. $VIX has been building a good base around the 14 - 15 area. Everytime $VIX made to that area, it rebounded upwards. Though $VIX hasn't moved much upwards, the key moving averages are crossed over making life further difficult for the risk-on market investing. I am using a short term moving average, 21 EMA and a long term moving average 89 EMA in this case. I have circled previous areas of  21 EMA crossing 89 EMA up. In those instances, results were not encouraging for the broad market. I would wait for the cross down of the same moving averages to put money to risk again. The market is there in the long run, we don't have to participate in the market every single day to make money in the long run. My suggestion is to stay in cash until the next opportunity comes our way. The chart is useful for intermediate term investors.

Visit StockCharts.com to see more great charts.

Wednesday, November 7, 2012

Market update

VST - Bearish
ST - Bearish
IT - Bullish yet
LT - Bullish yet

For trading, use SPY for $SPX, DIA for $INDU, QQQ for $NDX

Tuesday, October 23, 2012

$SPX update

My previous update about the market is here . I posted my outlook in all time frames in that post, it is good to know the market is following my outlook since then. We are a mere 13 $SPX points lower compared to Oct. 14th. The market went higher in the very short term and now is going lower.

Before I go to write further, my outlook for the next 2 weeks:

  VST - Bearish
 ST - Bearish still but see signs of + divergence to turn bullish
 IT and LT - Bullish still.

I want to write more about the ST here. Look at the chart below:

Price is going lower vs relative strength is at the same level or higher right now. If this chart should turn bullish, it needs to follow rules: RSI shouldn't go lower than previous low, RSI should turn higher, then buy when price closes above daily close 1417 on the /ES. The same divergence can be seen on the $SPX as well.

There are chances that the divergence may not end up into a bullish tone but watch for the above signs and play the game - good for few days as this is a daily chart.

Sunday, October 14, 2012

$SPX update

I was wondering about market correction going on currently, if it is a correction in a bull trend or something serious to take note of. 


Since the June 1st week low of 1274, $SPX rallied ~ 200 pts and topped out in September. There have been 6 minor corrections of 40 - 50 pts along the way. I highlighted them on the graph. All of those corrections didn't exceed more than 40 - 50 pts and maintained consistency. How come there was so much accuracy? This correction is also worth ~ 50 pts so far.There is a difference between the current one and the past 5 corrections in this intermediate trend. None of them tagged the lower bollinger band, the price had a good relative strength (RSI). With these key points in mind, I can conclude that this correction will fall further albeit there may be a bounce into next week because the market is oversold. $COMPX is doing worse than $SPX, $DJI is in a better strength - this is also a sign of coming market weakness. 

Very short term - oversold, looking for bounce
Short term - bearish
Intermediate term - bullish
Long term - bullish by a long way


Monday, October 8, 2012

Thursday, October 4, 2012

Walmart Inc.

My last buy of WMT was here http://silverven.blogspot.com/2012/04/buying-wal-mart-stores-inc-right-here.html posted on twitter on April 23 as well https://twitter.com/SilverVen . Up 25% from that move.


Right here, WMT has been on consolidation likely to breakout. Buying more on another breakout to ride higher.

+ Low beta, good yield/ dividend, good growth, emerging market expansion, increasing sales/ margins/ earnings...no sleepless nights. What's not to like it. Slow but major boost to your portfolio!

Saturday, September 29, 2012

AAPL - failed breakout


BO out of the channel was a failure. Look for a breakout up again or look for breakdown....and sell short with a stop!

Monday, September 3, 2012

The Big picture

The stock market has topped for this long term cycle. You have heard it here first! I am using key divergences with RSI and MACD (+ histogram) on the $SPX to understand this topping process. $DJI is showing a similar set up, while COMPX and RUT are not showing similar set ups but showing waning momentum. The The market has been pushing up even though momentum has been waning for almost 1 1/2 years now. As a result the market strength is relatively low. I marked the divergences on price and then the indicators. Use it as an example to see the same on the  topping process in 2007. All tops are not built the same, keep that in mind. As an example, this top could take longer and be very different than the previous one. Further, keep in mind that topping processes are complex and give a 5% rise above the high to be established. 

What would invalidate a top? Renewed strength in the said indicators RSI and MACD would invalidate the top for me. Meaning the indicators have to creep above their previous highs. 

Is it ideal to short the market here? I would not short the market here. Staying in cash is the strategy here. A close below the 50 period MA would be an ideal spot to short with a 5% stop above it. 


Thursday, August 30, 2012

Market update

Positions moved to cash. Will enter the market again from a lower prices.

Sunday, July 29, 2012

Eur/ USD

In the current season, Euro/ USD is correlated positively to the equity markets. The currency pair has a good positive divergence with my simple indicators like MACD, RSI 14 right now. Expecting a Euro rally i/ equities simultaneously in the next few days.

Wednesday, July 11, 2012

Target Inc.

Lately, big name retailers have been on a tear even as a the general stock market is faltering on its own. COST, WMT are at their all time highs. TGT too is on a verge of a breakout. 


You could buy on a successful breakout above $60. I bought some here myself anway and will add on the breakout up.

BTW, How is my WMT buy in April looking now after a 20% rise? ;) 

Friday, June 29, 2012

Inverted head and shoulders

The target on the /ES 1352 has been met per the Inverted head and shoulders as of now. My market outlook remains bullish with a 6% higher target but the markets need a bit of consolidation at this juncture. Buy the dips!


Wednesday, June 20, 2012

Market signals update - Buy

I have buy signals on the daily charts which extrapolates to short term.

US markets - Buy, I would buy any dips in the market.
Gold - Buy with a target of 1690$ and then I expect sell off to ~ 1300$
Crude oil - Neutral to bearish, I would stay away from it.

I have some good and interesting charts which I will share within 24 hours. BTW, I am ignoring the FOMC meeting. There could be some volatility but my signals include all of that volatility and much more.

Good trading all!

Monday, June 18, 2012

Chipotle Mexican Grill Inc.


Descending channel breakout to the upside. RSI also formed a price divergence on 3 prior price lows. You can also see a false channel breakout last week.