Saturday, April 19, 2014

Gold update

Last buy was at 1285$, check this update for previous comparison . We have been tracking that chart for several weeks now. I have had a Intermediate target of ~ 1550$ based on that chart and my signals. This week we had a turn on our IT and LT frames. I have a sell signal on daily and weekly time frames right now on Gold from a buy previously.
 
 
The best case for a bull right now is that we could be a in a chop. Unfortunately, I will take my signals. My stop is ~ $1,350. GDX is in a much worse position, BTW, obviously due to the recently sell off in the equities. 
 
All timesframes - Sell


Tuesday, April 15, 2014

Market update

Previous update here .
VST - turned bearish this hour
ST - Still bullish, losing steam
IT - Bearish
LT - Bearish
VLT - Bullish
 
GDX, GLD, /GC
 
VST, ST - Bearish
IT - Bullish but on edge
LT - Bullish (next update will be at end of week, last LT buy was at 1285 - /GC with a 3% stop)
VLT - Bearish
 

Monday, April 14, 2014

Market update

ST & VST & Very Long term - Bullish
Rest of the time frames  - Bearish


Saturday, April 12, 2014

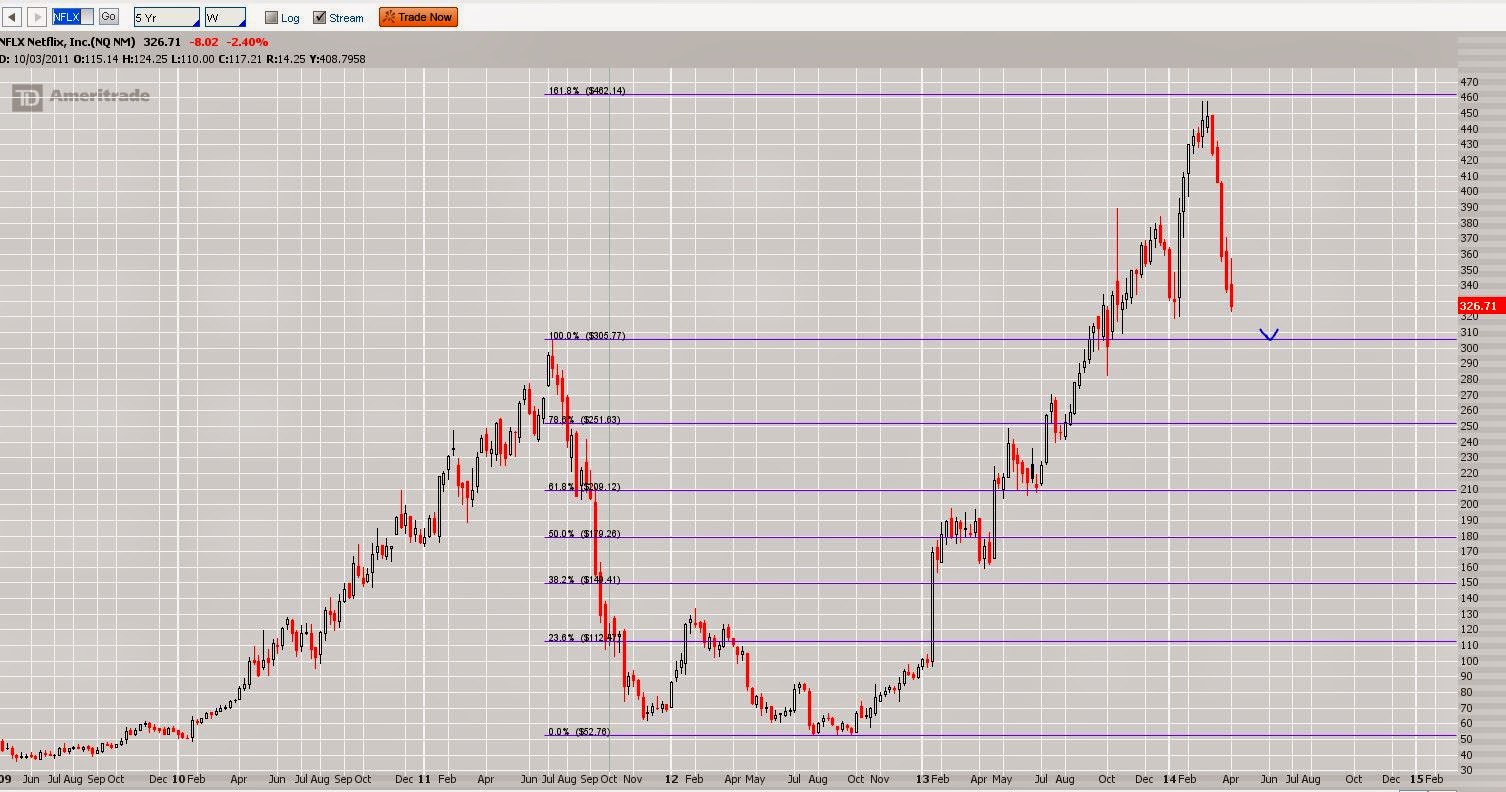
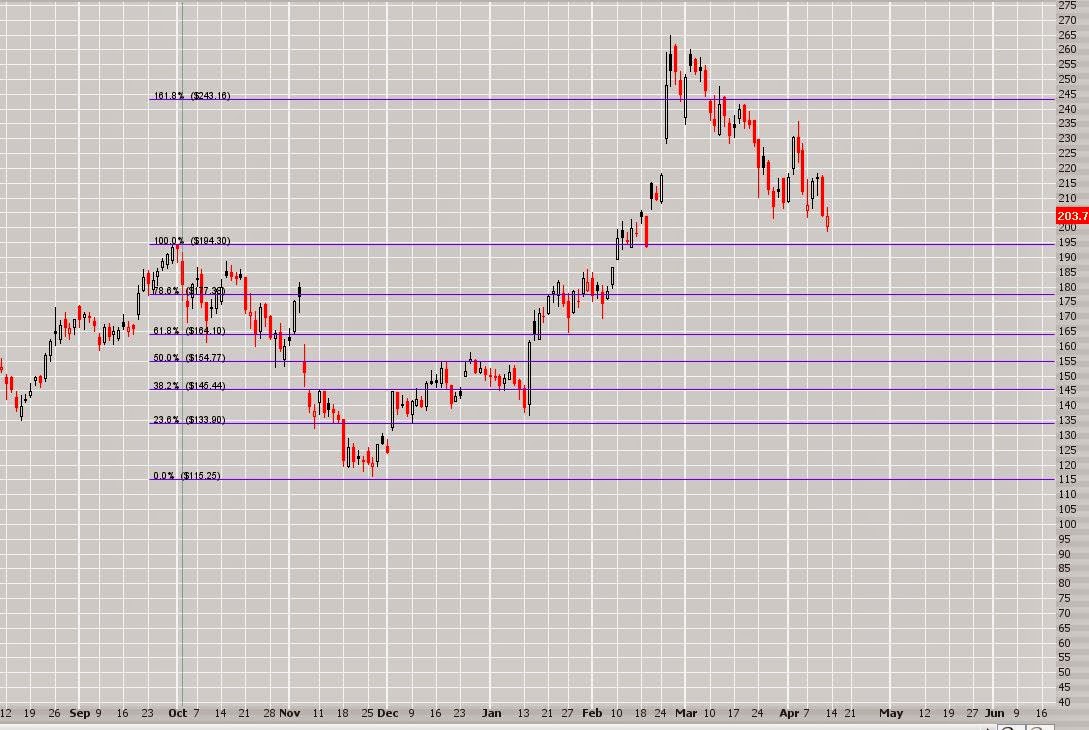
Netflix Inc. & Tesla


From the above Fib sequence charts, it should be very clear what the 1st targets for the current trend are. TSLA had a slight overshoot in its frothiness at the 161.8. Trend change before the support lines? I highly doubt it. But, will keep you informed if trend changes.