Silver Ven Capital
Introduction
Thursday, November 29, 2012
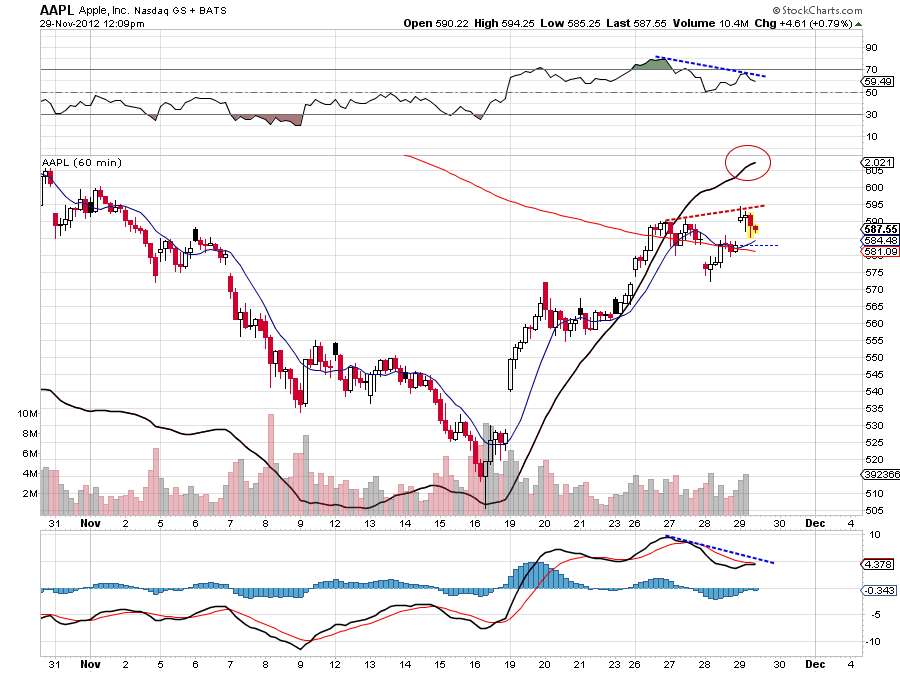
AAPL VST
Negative divergence on the hourly charts between price and oscillators. I expect the price to drop from here. The daily momentum is up, the weekly momentum is down. I will buy puts when that circled indicator turns down.
No comments:
Post a Comment
Newer Post
Older Post
Home
Subscribe to:
Post Comments (Atom)
No comments:
Post a Comment