As simple as it gets, NFLX breaks out on the hourly chart. Atleast the posture looks like so after consolidation of few days. Right now, as I type, the ticker is back in the channel in thr next hour candle. Apparently the volume is on the light side, breakouts of low volume doesn't last. Nevertheless, keep this under your watch list and buy on a confirmed breakout with appropriate stops. I believe that the breakout is to the upside. Should it be lower, short the ticker.
Tuesday, November 13, 2012
Sunday, November 11, 2012
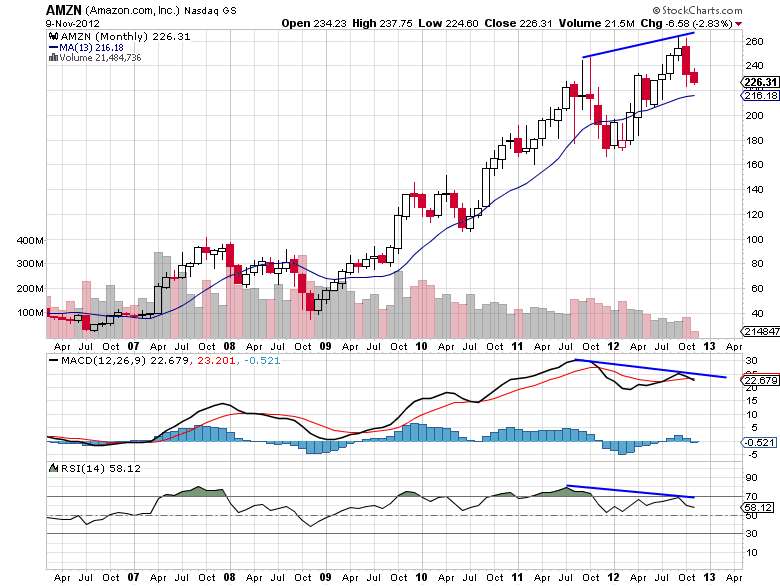
AMZN long term
AMZN peaked for the long term. The ship is going down. For this theory to be invalidated, AMZN must clear 250$.

Market update
Previous market update here .
VST - bearish yet, I don't see any signs of buy in the VST yet. Will update at the next instance of a buy.
ST - remains bearish
IT - cash
LT - remains on bullish signal
VST - bearish yet, I don't see any signs of buy in the VST yet. Will update at the next instance of a buy.
ST - remains bearish
IT - cash
LT - remains on bullish signal
Saturday, November 10, 2012
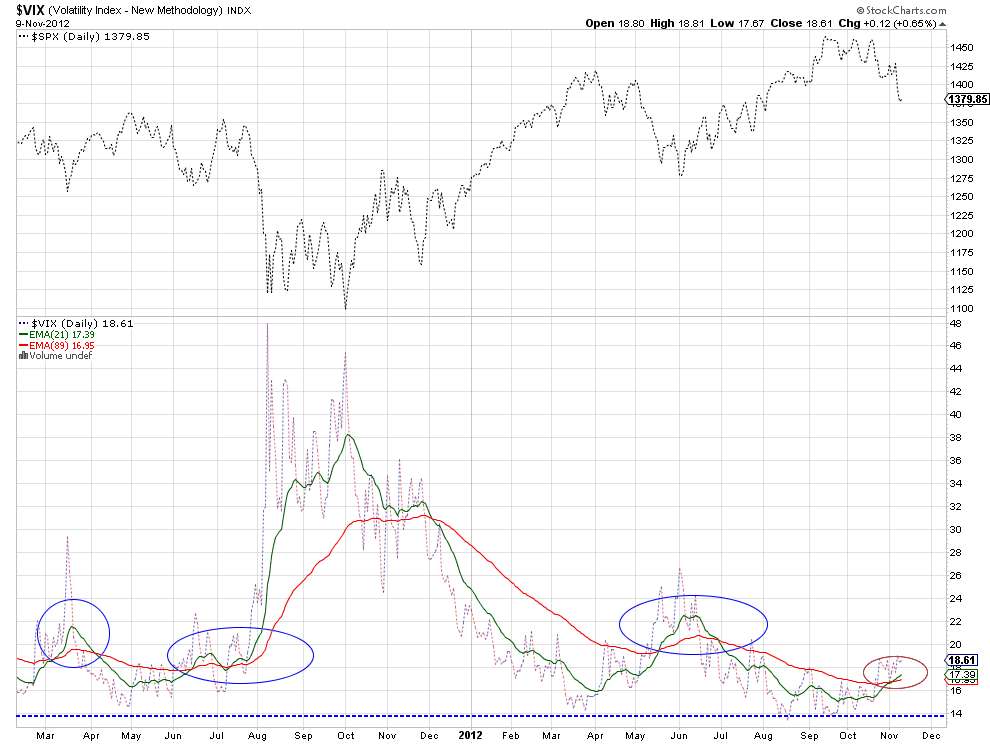
Using moving average cross-overs for $VIX
It was widely expected that the removal of uncertainity after the presidential elections will move the $VIX sharply down. After the elections, $VIX didn't fall. $VIX has been very stubborn, in fact. The results of the elections met with market sell off. $VIX has been building a good base around the 14 - 15 area. Everytime $VIX made to that area, it rebounded upwards. Though $VIX hasn't moved much upwards, the key moving averages are crossed over making life further difficult for the risk-on market investing. I am using a short term moving average, 21 EMA and a long term moving average 89 EMA in this case. I have circled previous areas of 21 EMA crossing 89 EMA up. In those instances, results were not encouraging for the broad market. I would wait for the cross down of the same moving averages to put money to risk again. The market is there in the long run, we don't have to participate in the market every single day to make money in the long run. My suggestion is to stay in cash until the next opportunity comes our way. The chart is useful for intermediate term investors.
Subscribe to:
Posts (Atom)