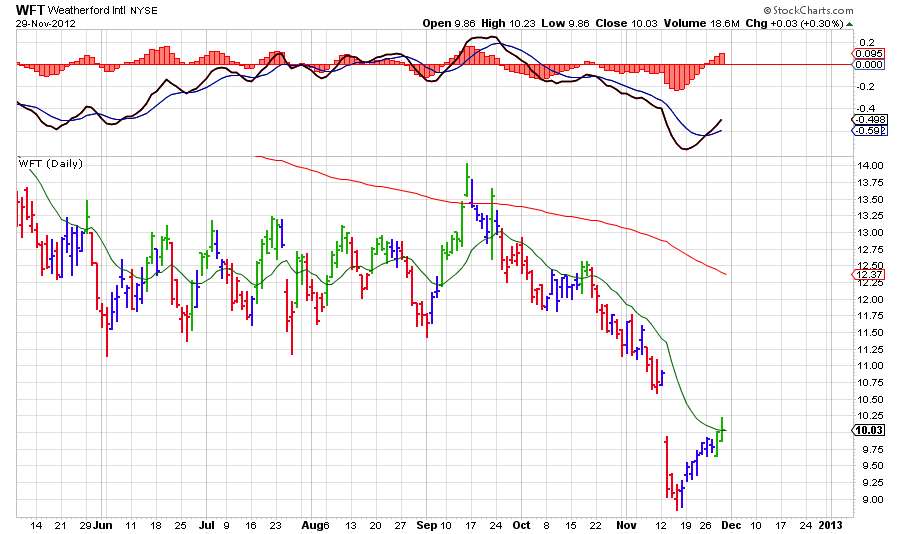
Sold short WFT yesterday before close, IT trade
Friday, November 30, 2012
Thursday, November 29, 2012
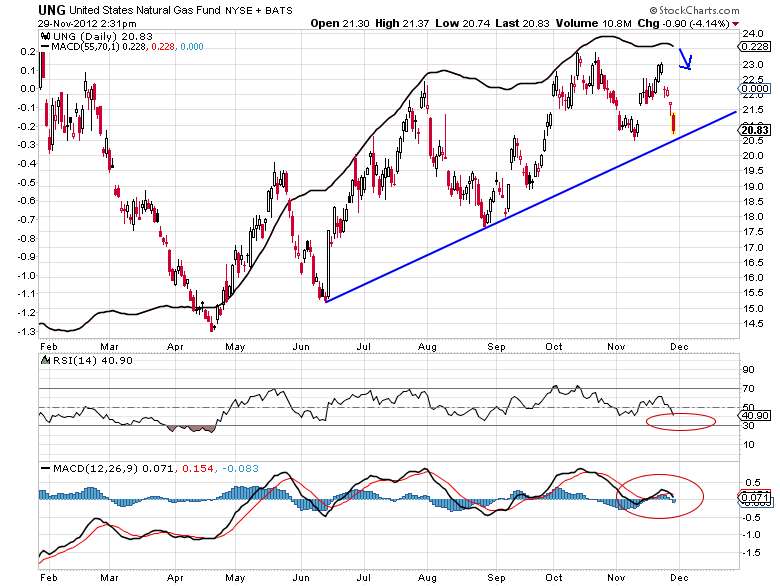
UNG
Sold short UNG. Reckon the winning trade of the year has turned. Soon expect to break that trendline.
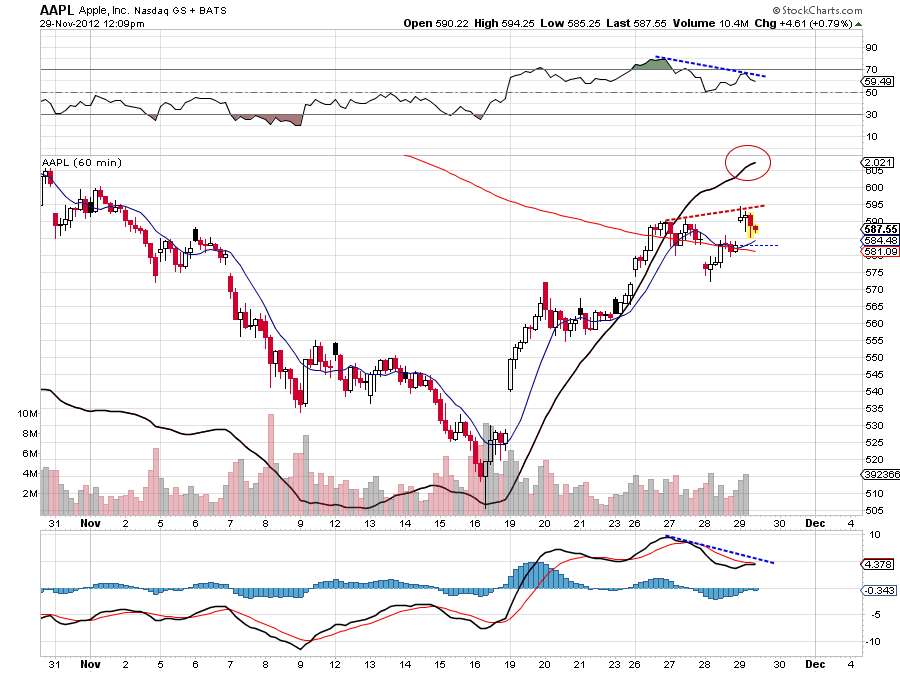
AAPL VST
Negative divergence on the hourly charts between price and oscillators. I expect the price to drop from here. The daily momentum is up, the weekly momentum is down. I will buy puts when that circled indicator turns down.
TIF trade
Bought TIF in premarket at 56$. Stops at premarket lows. Looking for a flip, but the chart looks good for a buy in the IT.
Wednesday, November 28, 2012
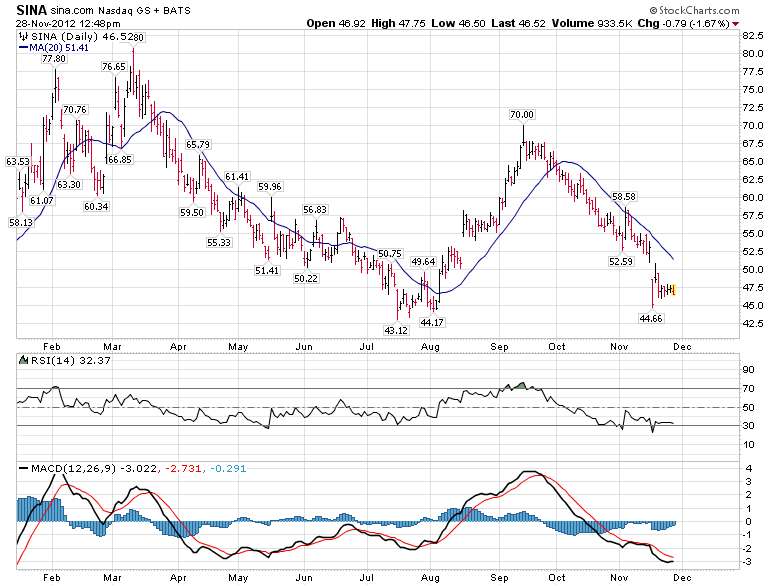
SINA
Sold SINA today morning. Holding short SINA in the Intermediate term. Look below for the market update posted earlier.
Market update
VST Bullish
ST bearish
IT bearish
LT bullish
...based on $SPX. Trade with $SPY
ST bearish
IT bearish
LT bullish
...based on $SPX. Trade with $SPY
Friday, November 23, 2012
Market update
Previous market update is here .
VST remains bullish but could get a sell in 2 days
ST - bearish
IT - bearish
LT - bullish
Thursday, November 22, 2012
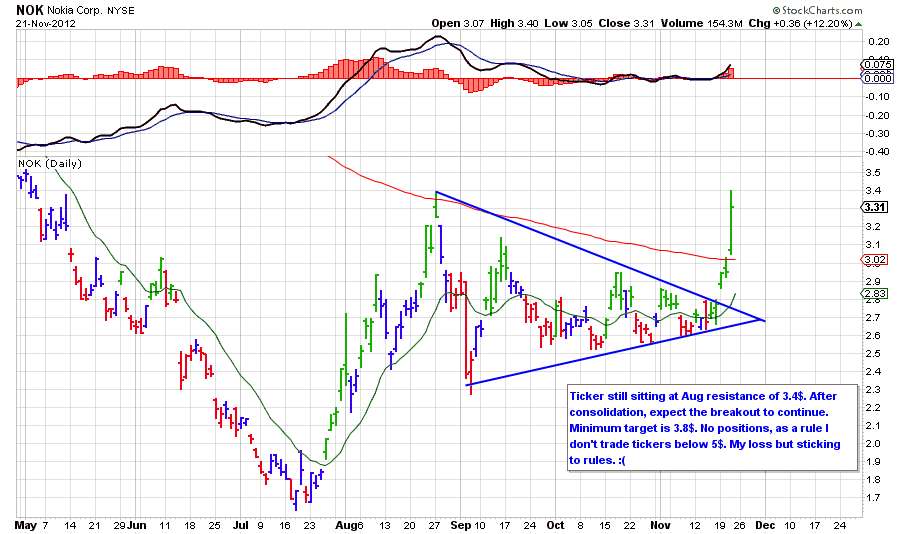
Nokia corporation
Bullish, buy after some consolidation
Wednesday, November 21, 2012
NUAN
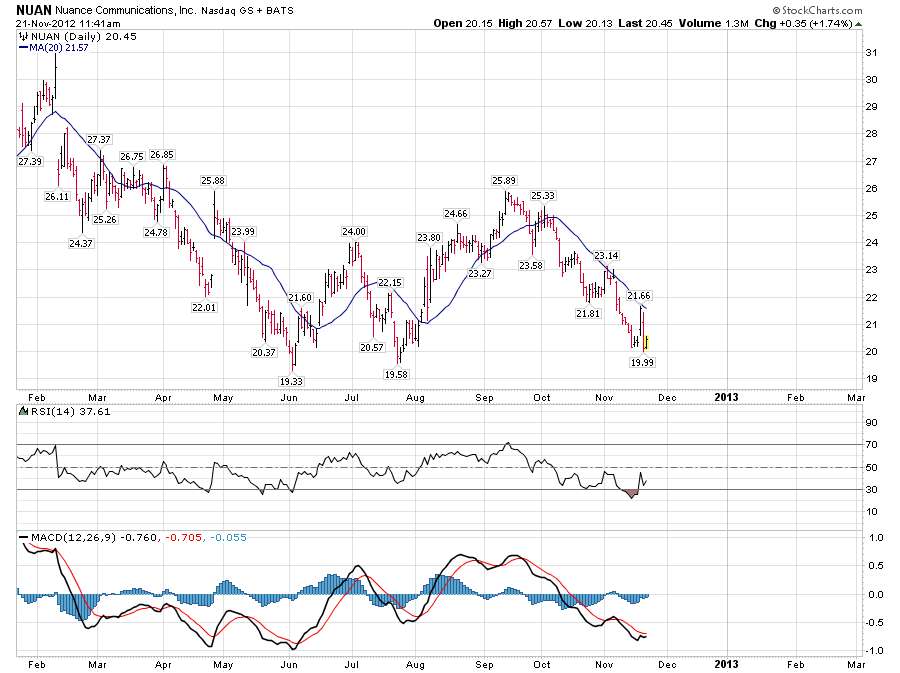
Selling short NUAN, stop at 22.5$. The 19.5 - 20$ support should break eventually.
GOOG
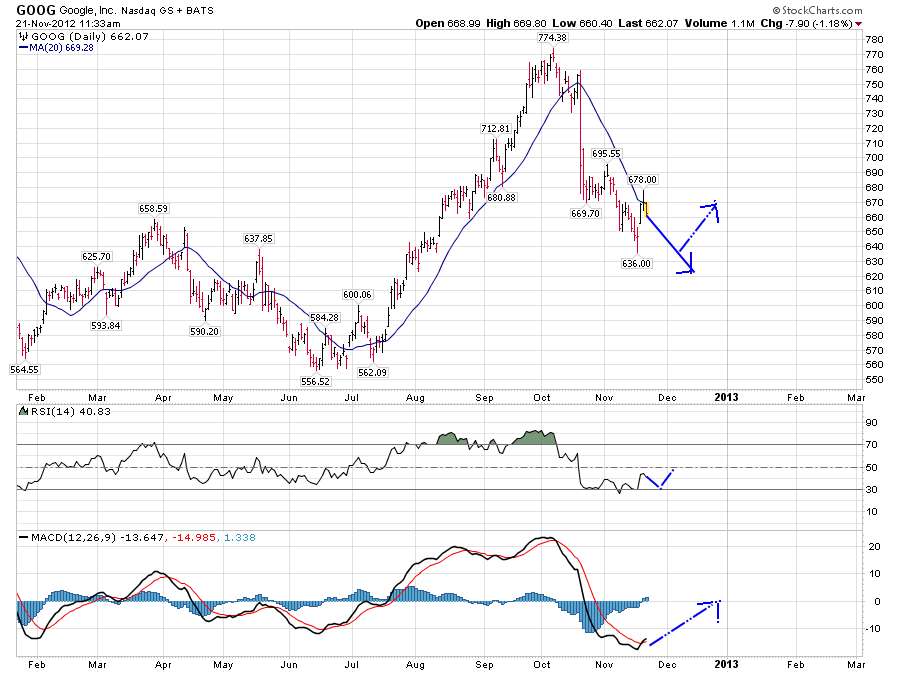
I believe GOOG counter trend rally is over. In the next few days, GOOG will either post a low at the 11/16 or lower than that. No positions, just interested in watching.
Tuesday, November 20, 2012
AAPL - MACD crossed up today
My previous post on AAPL, that is for intermediate term outlook, no change right now on that opinion.
Intermediate trend remains on a sell, sell all rallies into it. You will see a lower low below $505 and several lows in few weeks - months.
Sunday, November 18, 2012
Ringing the register - capital gain taxes
Investors have been puzzled why the (supposedly) best tech stock in the world AAPL has entered the bear market territory recently. One of the thesis that has been floating around is, long term investors are locking their profits after a tremendous 3 year run. On the other hand, stocks like RIMM, FB which have been on the losing end have gained in the last 2 months. How come? Investors who have been long the winning stocks are closing their positions by selling, while investors who have been short the losing stocks are closing their positions by covering. A strong reason to believe this is probably an increase in capital gains taxes next year. The 1st chart shows YTD run in all the highlighted names.
The 2nd chart shows the performance in the last 3 months.
So, should you be loading on the winners, after this 'sale' is over? If you believe the strong fundamentals are intact, you may do so with caution. But, I insist that you exhibit a fair bit of caution in buying stocks whose technicals have been severely damaged like this one. Damage to the technicals in a stock will skew the view of investors, no doubt. Till the time the technicals are corrected, you may stay away from those stocks.
I included Homedepot HD which has been up a good % in both the charts, despite selling seen in other names. HD is sound both technically as well as fundamentally. In ideal case, given the ongoing market correction, I am not suggesting you to go long any stock right away. But, should the market rally after the market internals rise, names like this would be the 1st on the radar.
Saturday, November 17, 2012
Market update
Market update is typically given for $SPX. Use $SPY to trade the market.
VST - Bullish
ST - Bearish
IT - Bearish
LT - Bullish
Emerging market's have been outperforming the US markets for the last 2 months now. Recommendation is to short the Qs and go long the EEM. Since September, this trade netted 10% +. I believe the same trade will continue to outperform in the very short term (VST = 3-5 days) and the short term (ST = 20 - 25 days).
I posted AAPL's outlook for the next few months last night, don't miss to read it.
Friday, November 16, 2012
Fortunes will be made and lost - AAPL
This is wallstreet. Fortunes are made and lost here in regular and tandem fashion. That is no surprise. We see a dot-boom go bust with high degree of periodicity. AAPL as a stock is up 30% YTD. That is not the full story though. It was up about 74% about 2 months back. It retraced 25% since it's Sept high of $704. That is still not what bothers me. The velocity with which it is sold incessantly, despite being the global innovative leader in a bunch of leading electronic devices, holding 100s of billion $s of cash in hand, solid reputation at stake is what makes me think deep. Something is wrong behind the curtains. Also, it is easy to justify the high market cap when the company is at its prime, people realize the problems only when the stock goes bust. While we don't yet know what that 'something' is, our charts show that the ticker is very very disturbed. It is often said that the stock market is often a reflection of behind-the-scenes action, I can't comprehend what I am seeing. Wall street is brutal and doesn't care for reputation, innovation or leadership.
For comparison, I have summoned the great dot-busts from the 2000 stock bombs. I looked at almost 100 charts of tickers including YHOO, MSFT, AMZN, PCLN (all of which still exist, only with a minuscule of their stock's prime valuation) and then some tickers which don't exist like BCOR, NVTL. I noticed that in today's AAPL chart, the MACD indicator is extremely oversold. A bottom or top in the MACD indicator never ever occurs simultaneously at the same time with the price of a ticker. Usually the MACD indicator tops or bottoms and then days-months later the price bottoms. Sometimes years later, in extreme cases like this. The MACD indicator has gone below - 25 which we rarely see. It often indicates violent plunges are ahead. There may be short killer rallies in between but these kind of stocks with extreme monstrosity are hard to predict and more often than not end up losing most of the market cap. I know, it is hard to imagine AAPL going bust with virtues as underlined above but this is wall street folks. You could create history or you can be history riding AAPL from here.
I am including charts of BCOR, NVTL, PCLN from the dot bomb era, GOOG and FSLR from 2008 market crash, PCLN and CMG from the current era from the comparison with current AAPL's chart below. BCOR, NVTL went chapter 11 while PCLN recovered. PCLN continues to show the same violence with precision every year in its charts. CMG is the latest example of one high flying stock which has gone bust in recent times.
Bottomline is - All time top in AAPL is in. The bottom of short term, Intermediate term or long term is not yet seen. Extreme and violent moves on both directions will continue in the months ahead. I am reading several posts of 'V' bottom. Yeah, right! It is not that easy, folks! Bookmark this post and we will meet in 6 months.
In the charts below, concentrate on MACD extreme reading and what fate followed for each ticker ahead.
Current AAPL
BCOR from dot-bomb era
NVTL from dot-bomb era
PCLN from dot-bomb era
PCLN current chart
GOOG from 2008 crash
FSLR current
CMG current
AAPL current
Thursday, November 15, 2012
AAPL divergence
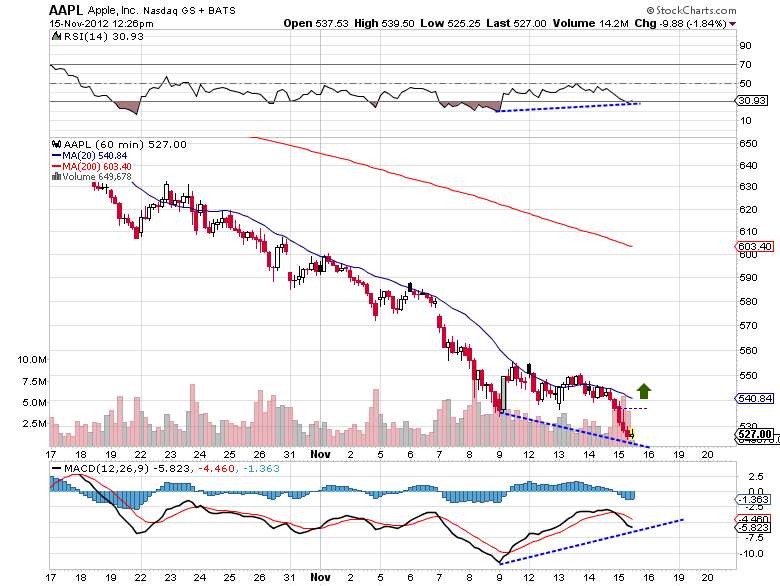
As simple as it gets, there is + divergence between indicators and price here. Price = lower low, indicators (internals) = higher. I would wait for the turn up in the indicators. Will add more on the break above 540$. This is very short term trade based on hrly chart. Place appropriate stops, don't forget it.
Tuesday, November 13, 2012
NFLX
As simple as it gets, NFLX breaks out on the hourly chart. Atleast the posture looks like so after consolidation of few days. Right now, as I type, the ticker is back in the channel in thr next hour candle. Apparently the volume is on the light side, breakouts of low volume doesn't last. Nevertheless, keep this under your watch list and buy on a confirmed breakout with appropriate stops. I believe that the breakout is to the upside. Should it be lower, short the ticker.
Sunday, November 11, 2012
AMZN long term
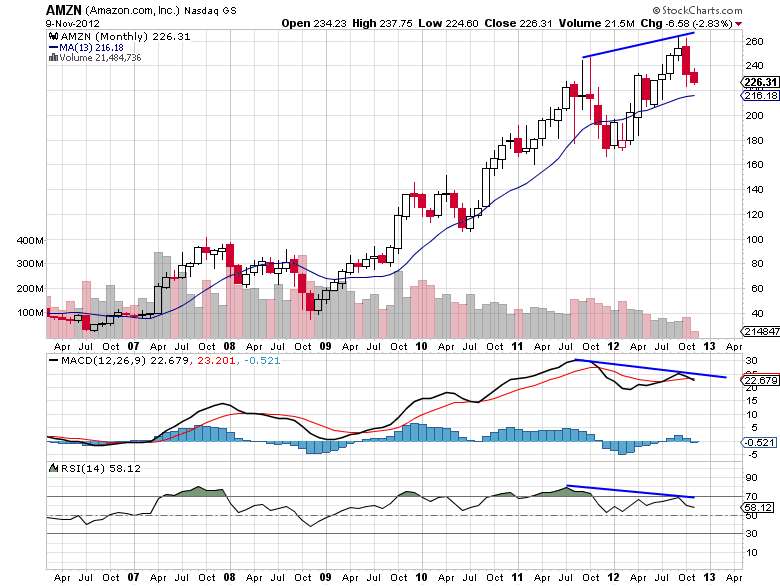
AMZN peaked for the long term. The ship is going down. For this theory to be invalidated, AMZN must clear 250$.
Market update
Previous market update here .
VST - bearish yet, I don't see any signs of buy in the VST yet. Will update at the next instance of a buy.
ST - remains bearish
IT - cash
LT - remains on bullish signal
VST - bearish yet, I don't see any signs of buy in the VST yet. Will update at the next instance of a buy.
ST - remains bearish
IT - cash
LT - remains on bullish signal
Saturday, November 10, 2012
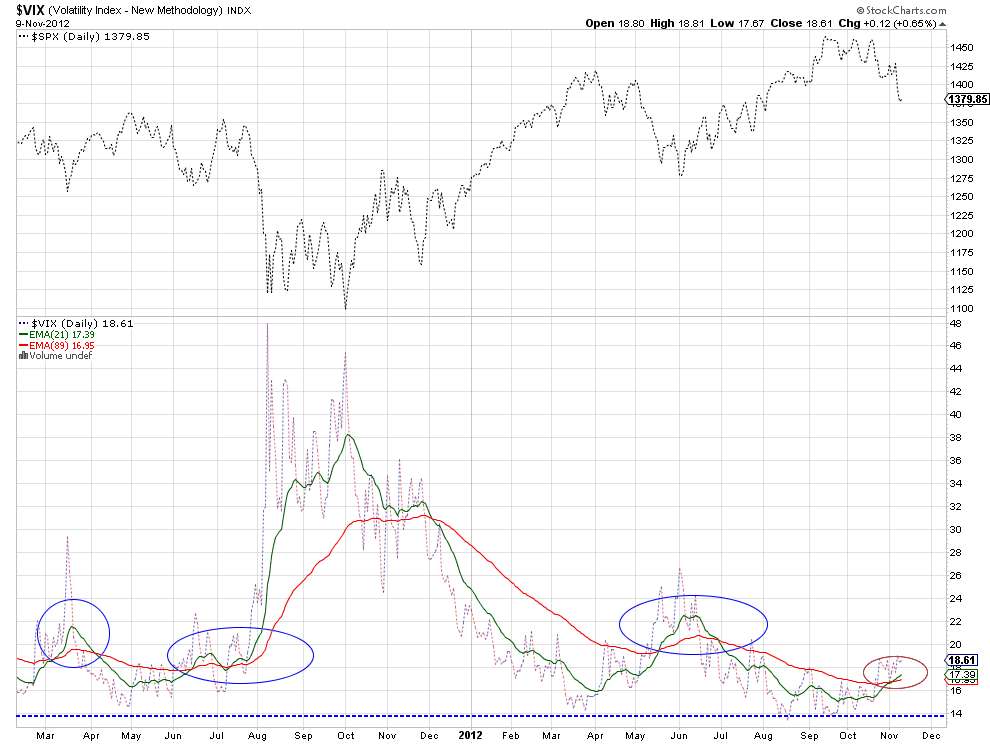
Using moving average cross-overs for $VIX
It was widely expected that the removal of uncertainity after the presidential elections will move the $VIX sharply down. After the elections, $VIX didn't fall. $VIX has been very stubborn, in fact. The results of the elections met with market sell off. $VIX has been building a good base around the 14 - 15 area. Everytime $VIX made to that area, it rebounded upwards. Though $VIX hasn't moved much upwards, the key moving averages are crossed over making life further difficult for the risk-on market investing. I am using a short term moving average, 21 EMA and a long term moving average 89 EMA in this case. I have circled previous areas of 21 EMA crossing 89 EMA up. In those instances, results were not encouraging for the broad market. I would wait for the cross down of the same moving averages to put money to risk again. The market is there in the long run, we don't have to participate in the market every single day to make money in the long run. My suggestion is to stay in cash until the next opportunity comes our way. The chart is useful for intermediate term investors.
Wednesday, November 7, 2012
Market update
VST - Bearish
ST - Bearish
IT - Bullish yet
LT - Bullish yet
For trading, use SPY for $SPX, DIA for $INDU, QQQ for $NDX
ST - Bearish
IT - Bullish yet
LT - Bullish yet
For trading, use SPY for $SPX, DIA for $INDU, QQQ for $NDX
Subscribe to:
Posts (Atom)